

Traumatic Spinal Cord Injury Statistics (2026): Mechanisms, Severity, and Survival Data
About 18,421 Americans suffer a traumatic spinal cord injury every year, an injury caused not by disease but by a sudden physical impact, most often a car crash, a fall, or an act of violence. This 2026 reference focuses specifically on traumatic spinal cord injury: how it differs from non-traumatic injury, how severity is graded, and what the data shows about survival, all drawn from the National Spinal Cord Injury Statistical Center.
- About 18,421 traumatic spinal cord injuries occur in the US each year, roughly 54 per million people, not counting those who die at the scene.
- Vehicle crashes (37.3%) and falls (32.0%) cause nearly 70% of traumatic injuries; violence adds 15.5% and sports 7.7%.
- Traumatic injury differs from non-traumatic in cause, patient profile, and often the legal context, since traumatic injuries frequently involve a liable third party.
- The ASIA Impairment Scale (A to E) is the standard measure of severity; incomplete injuries (grades B to D) now outnumber complete ones.
- Life expectancy remains below the general population and has not meaningfully improved since the 1980s for those surviving the first year.
- Respiratory disease is the leading cause of death after the first year at 19.6%, reflecting the long-term secondary risks of the injury.
- Mortality is highest in the first year after injury, especially for the most severe neurological impairments.
What's in This Guide
Traumatic vs Non-Traumatic Injury
Not every spinal cord injury is traumatic. Clinicians divide the condition into two broad categories by cause, and the distinction shapes everything from patient profile to treatment path to the legal questions that follow.
A traumatic spinal cord injury (tSCI) results from a sudden external physical force: a vehicle crash, a fall, a gunshot, a sports collision. A non-traumatic injury results from an internal process instead, such as a tumor pressing on the cord, an infection, a vascular event, or degenerative spine disease. Most of the widely cited US statistics, including the annual incidence figure, track traumatic injuries specifically, because the National Spinal Cord Injury Statistical Center database is built around them.
Why the distinction matters for patients: Non-traumatic injuries, driven by tumors and degenerative disease, are rising as the population ages. Traumatic injuries, by contrast, are sudden events that frequently involve another party's negligence, which is why they so often intersect with personal injury law. The medical evaluation is similar; the surrounding circumstances are not.
Source: World Health Organization
Explore the spine conditions we treatHow Common Traumatic SCI Is
Traumatic spinal cord injury is uncommon relative to other neurological conditions, but its permanence means a large population lives with it at any given time.
The incidence figure carries an important caveat: it excludes people who die at the location of the injury before reaching a hospital. The true number of traumatic spinal cord injuries occurring each year is therefore higher than the reported incidence. For the fuller demographic and prevalence picture, see our complete spinal cord injury statistics overview.
Source: National Spinal Cord Injury Statistical Center
Mechanisms of Injury
How traumatic injuries happen has shifted over the decades. Vehicle crashes remain the single largest cause, but falls have climbed sharply as the injured population ages, and together the two now account for nearly 70% of cases.
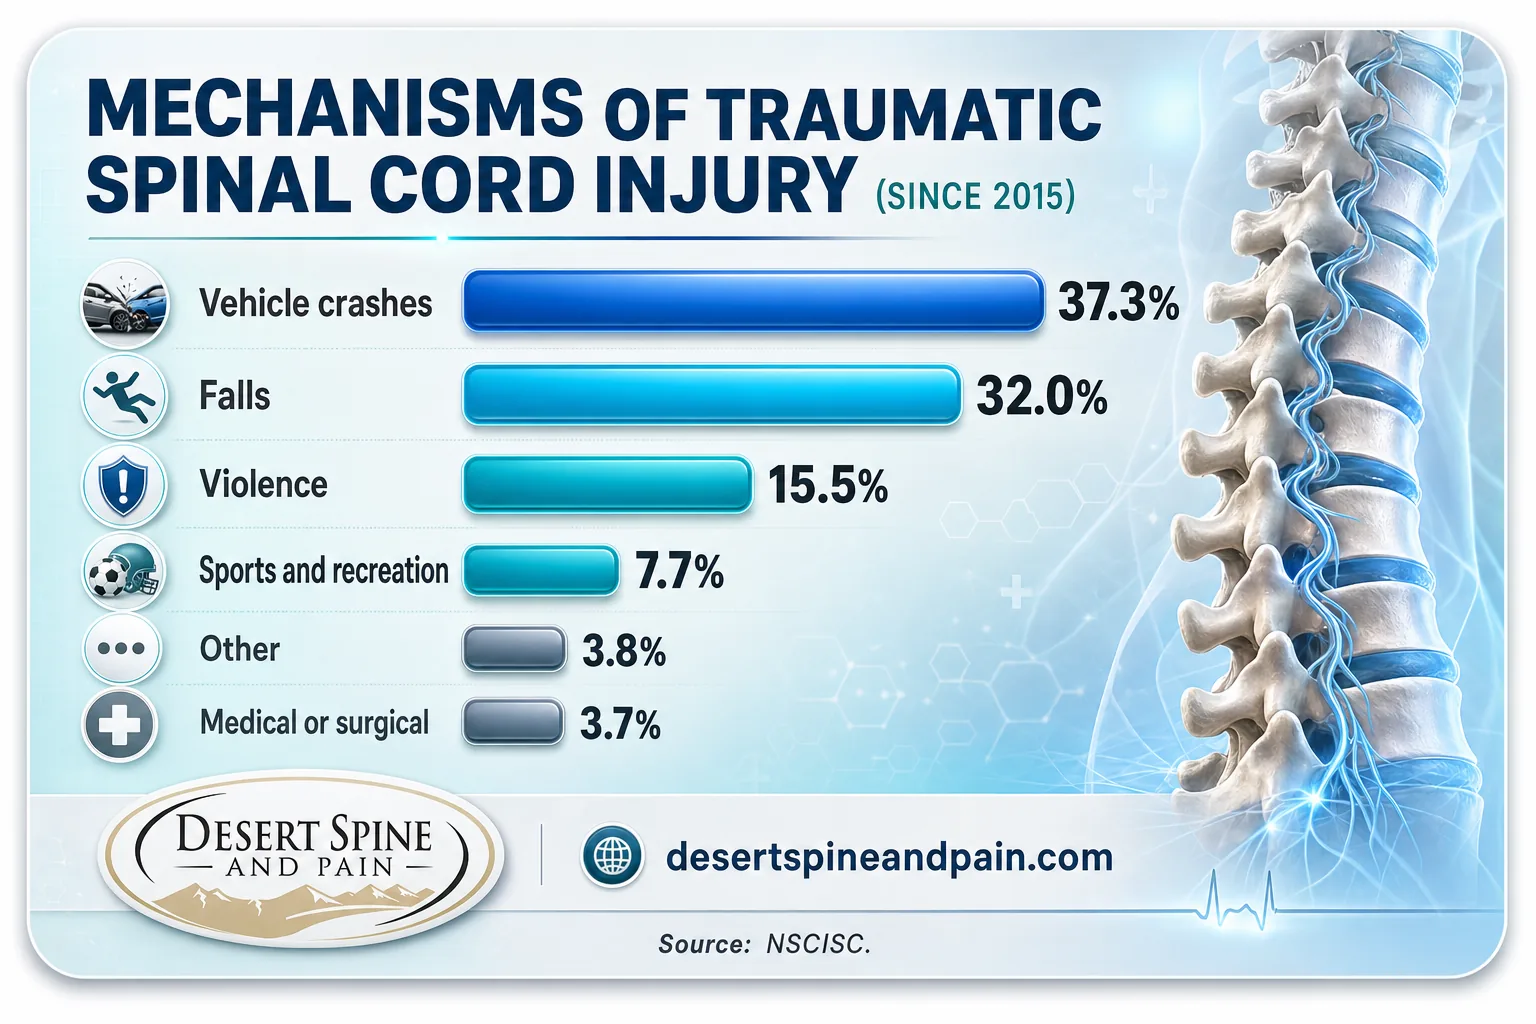
Mechanisms of Traumatic Spinal Cord Injury Since 2015 (% of cases)
Each of these mechanisms carries a different injury pattern. High-speed crashes tend to produce cervical injuries; falls among older adults often involve pre-existing spinal degeneration that makes the cord more vulnerable; violence disproportionately produces complete injuries. The mechanism is not just a statistic, it shapes the clinical picture the surgeon evaluates.
Source: NSCISC Causes of SCI
See our spine surgery optionsASIA Grades and Severity
Clinicians grade the severity of a traumatic spinal cord injury using the American Spinal Injury Association Impairment Scale, known as the AIS or ASIA scale. It runs from A to E and is the standard language for describing how complete an injury is.
| Grade | What it means |
|---|---|
| AIS A | Complete. No motor or sensory function preserved below the injury level. |
| AIS B | Sensory incomplete. Some sensation preserved below the level, but no motor function. |
| AIS C | Motor incomplete. Some movement preserved, but most key muscles are weak. |
| AIS D | Motor incomplete. Most key muscles below the level can move against gravity. |
| AIS E | Normal. Motor and sensory function are normal. |
Severity is also described by the categories the NSCISC tracks, which combine level (tetraplegia vs paraplegia) with completeness. Incomplete tetraplegia is now the single most common outcome.
| Neurological category | Share since 2015 |
|---|---|
| Incomplete tetraplegia | 47.6% |
| Incomplete paraplegia | 20.3% |
| Complete paraplegia | 19.6% |
| Complete tetraplegia | 12.1% |
| Normal at discharge | 0.5% |
Myth: a traumatic spinal cord injury always means complete paralysis. The AIS scale exists precisely because injuries vary so widely. Complete (AIS A) injuries are now a minority; incomplete injuries where some function is preserved are more common. Grade, level, and age at injury, not the label "spinal cord injury," determine what recovery is realistic. Every injury is different, which is why individual evaluation by a spine specialist matters.
Source: StatPearls, National Library of Medicine
Learn about spinal decompression surgeryLife Expectancy and Survival
One of the most sobering findings in the traumatic spinal cord injury data is that survival gains have stalled. Life expectancy for people with tSCI remains well below that of the general population, and for those who survive the first year, it has not improved meaningfully since the 1980s.
Survival depends heavily on the level and completeness of the injury and on age at injury. Peer-reviewed analyses of the NSCISC database show life expectancy falling as neurological grade worsens. In one NSCISC-based study of thoracic injuries at age 35, median estimated life expectancy ranged from about 32 years for the most complete injuries to about 39 years for the least severe, a gap that widens the more severe the injury.
Desert Spine and Pain Analysis: The survival gap is a care-continuity gap. The NSCISC data shows two things at once: mortality peaks in year one, and long-term life expectancy has been flat since the 1980s. Read together, they point to the same conclusion, that the greatest gains come from expert acute management early and consistent specialist follow-up for secondary complications later. Calculation and interpretation original to Desert Spine and Pain, derived from NSCISC first-year mortality and long-term life-expectancy findings.
Source: NSCISC Life Expectancy Calculator
Explore interventional pain managementLeading Causes of Death
The causes of death after traumatic spinal cord injury reveal where the long-term medical risks concentrate. They are dominated not by the original injury but by its secondary complications, many of which are manageable with vigilant follow-up care.
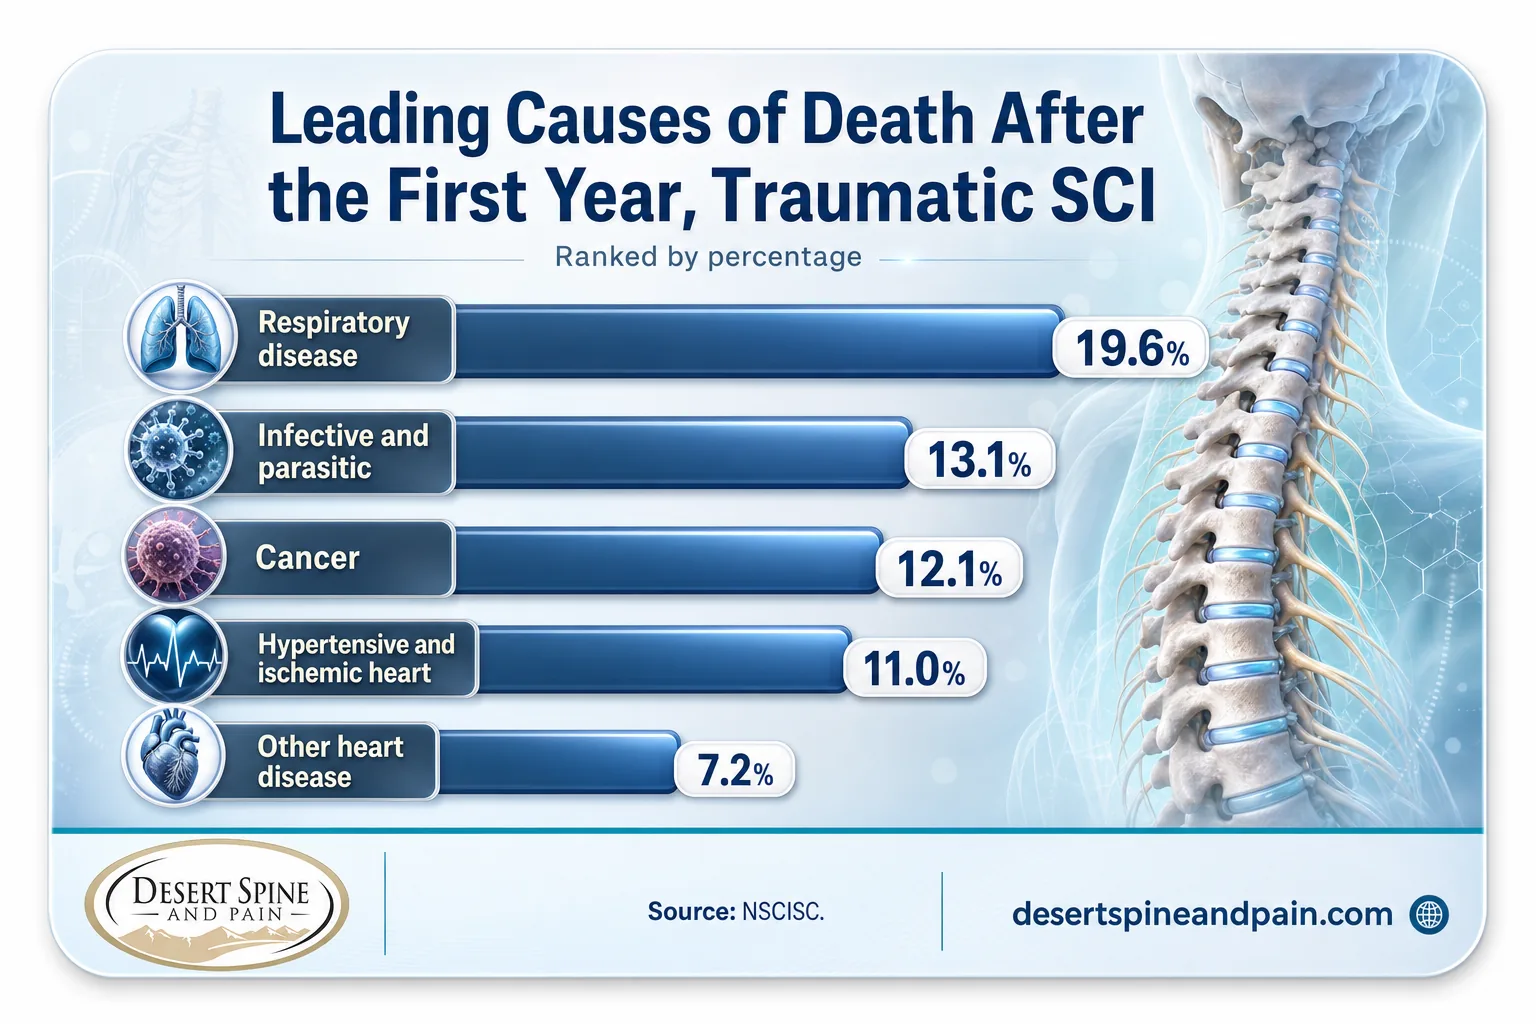
Respiratory disease and infections together account for roughly a third of deaths after the first year. Both are strongly tied to preventable and treatable secondary conditions, which underscores how much long-term outcomes depend on continuous, specialized care rather than the acute injury alone.
Source: National Spinal Cord Injury Statistical Center
The Personal Injury Dimension
Because traumatic spinal cord injuries so often result from crashes, falls, and violence, they frequently involve a liable third party, which places them at the center of personal injury law. The statistics that describe severity, life expectancy, and lifetime cost of care are the same figures that determine the value of a claim.
For personal injury attorneys: Desert Spine and Pain supports attorneys and their clients through the full arc of spine care, with fast response, coordination of documentation, and evaluation by a board-certified spine surgeon and neurosurgeon. When a client's future care needs and cost of care are central to a case, having a top-tier surgeon involved early strengthens both the treatment and the record. We work with out-of-network patients of every kind.
Source: National Spinal Cord Injury Statistical Center
Partner with us on a spine caseFull Statistics Table
| Statistic | Figure | Source | Year |
|---|---|---|---|
| New US tSCI cases per year | 18,421 | NSCISC | 2026 |
| Annual incidence rate | 54 per million | NSCISC | 2026 |
| People living with tSCI (US) | 308,620 | NSCISC | 2026 |
| Prevalence range | 259,374–393,913 | NSCISC | 2026 |
| Cause: vehicle crashes | 37.3% | NSCISC | 2026 |
| Cause: falls | 32.0% | NSCISC | 2026 |
| Cause: violence | 15.5% | NSCISC | 2026 |
| Cause: sports/recreation | 7.7% | NSCISC | 2026 |
| Cause: medical/surgical | 3.7% | NSCISC | 2026 |
| Incomplete tetraplegia | 47.6% | NSCISC | 2026 |
| Incomplete paraplegia | 20.3% | NSCISC | 2026 |
| Complete paraplegia | 19.6% | NSCISC | 2026 |
| Complete tetraplegia | 12.1% | NSCISC | 2026 |
| Death after year 1: respiratory | 19.6% | NSCISC | 2026 |
| Death after year 1: infective/parasitic | 13.1% | NSCISC | 2026 |
| Death after year 1: cancer | 12.1% | NSCISC | 2026 |
| Death after year 1: hypertensive/ischemic heart | 11.0% | NSCISC | 2026 |
| Death after year 1: other heart | 7.2% | NSCISC | 2026 |
Frequently Asked Questions
What is the difference between traumatic and non-traumatic spinal cord injury?
What is the ASIA Impairment Scale?
What is the leading cause of traumatic spinal cord injury?
What is the life expectancy after a traumatic spinal cord injury?
What are the leading causes of death after a traumatic spinal cord injury?
Methodology & Sources
All US incidence, prevalence, cause, severity, life-expectancy, and cause-of-death figures in this article come from the National Spinal Cord Injury Statistical Center (NSCISC) Traumatic Spinal Cord Injury Facts and Figures at a Glance data sheet, published by the University of Alabama at Birmingham in collaboration with the Model Systems Knowledge Translation Center. ASIA Impairment Scale definitions follow the American Spinal Injury Association standard as described in StatPearls (National Library of Medicine). Grade-specific life expectancy figures are drawn from peer-reviewed analyses of the NSCISC Model Systems database. The traumatic versus non-traumatic distinction follows the World Health Organization spinal cord injury fact sheet. Cause-of-death percentages refer to deaths occurring after the first year post-injury. This article is informational and is not individual medical advice; anyone dealing with a spine injury should seek evaluation from a qualified specialist.
Media and press: Journalists and researchers are welcome to cite these statistics with attribution to the original primary sources named above, and to Desert Spine and Pain for any analysis labeled as original.



