

Spinal Cord Injury Statistics (2026): Incidence, Causes, Costs, and Recovery Data
Every year in the United States, about 18,421 people suffer a traumatic spinal cord injury, and roughly 308,620 are living with one right now. This 2026 reference pulls together the most current primary data on how these injuries happen, who they affect, what recovery looks like, and what they cost, drawn from the National Spinal Cord Injury Statistical Center and other primary datasets.
- About 18,421 new traumatic spinal cord injuries occur in the US each year, or about 54 per million people, not counting those who die at the scene.
- Roughly 308,620 Americans are living with traumatic spinal cord injury, with estimates ranging from 259,374 to 393,913.
- Vehicle crashes (37.3%) and falls (32.0%) cause nearly 70% of recent injuries; violence and sports account for most of the rest.
- Incomplete tetraplegia is now the most common outcome at 47.6%, and fewer than 1% of people fully recover neurologically by discharge.
- Lifetime costs reach $6.26 million for the most severe injuries at age 25, before indirect losses like wages, which average $95,309 per year.
- The average age at injury has climbed to 44 years, up from 29 in the 1970s, as falls among older adults rise.
- Worldwide, over 15 million people live with spinal cord injury, and most cases are preventable trauma.
What's in This Guide
Incidence and Prevalence
Traumatic spinal cord injury is relatively rare compared with other neurological conditions, but its permanence makes prevalence climb over time. The National Spinal Cord Injury Statistical Center (NSCISC) estimates the annual incidence at about 54 cases per one million people, which works out to roughly 18,421 new injuries a year in a US population of about 341 million.
One important caveat sits behind every incidence figure: the count excludes people who die at the location of the injury before reaching a hospital. The real number of spinal cord injuries occurring each year is therefore higher than the reported incidence. The prevalence range is wide because it is modeled rather than counted directly, reflecting uncertainty in long-term survival.
Why prevalence keeps rising: Because spinal cord injuries are permanent and survival has improved since the 1970s, more people live for decades after injury. New cases add to a population that shrinks slowly, so the total living with tSCI trends upward even when annual incidence holds steady.
Source: National Spinal Cord Injury Statistical Center
Explore spine and nerve conditions we treatLeading Causes of Spinal Cord Injury
The causes of spinal cord injury have shifted over the past few decades. Vehicle crashes remain the single largest cause, but falls have risen sharply as the population ages, and the two now account for nearly 70% of recent injuries together.
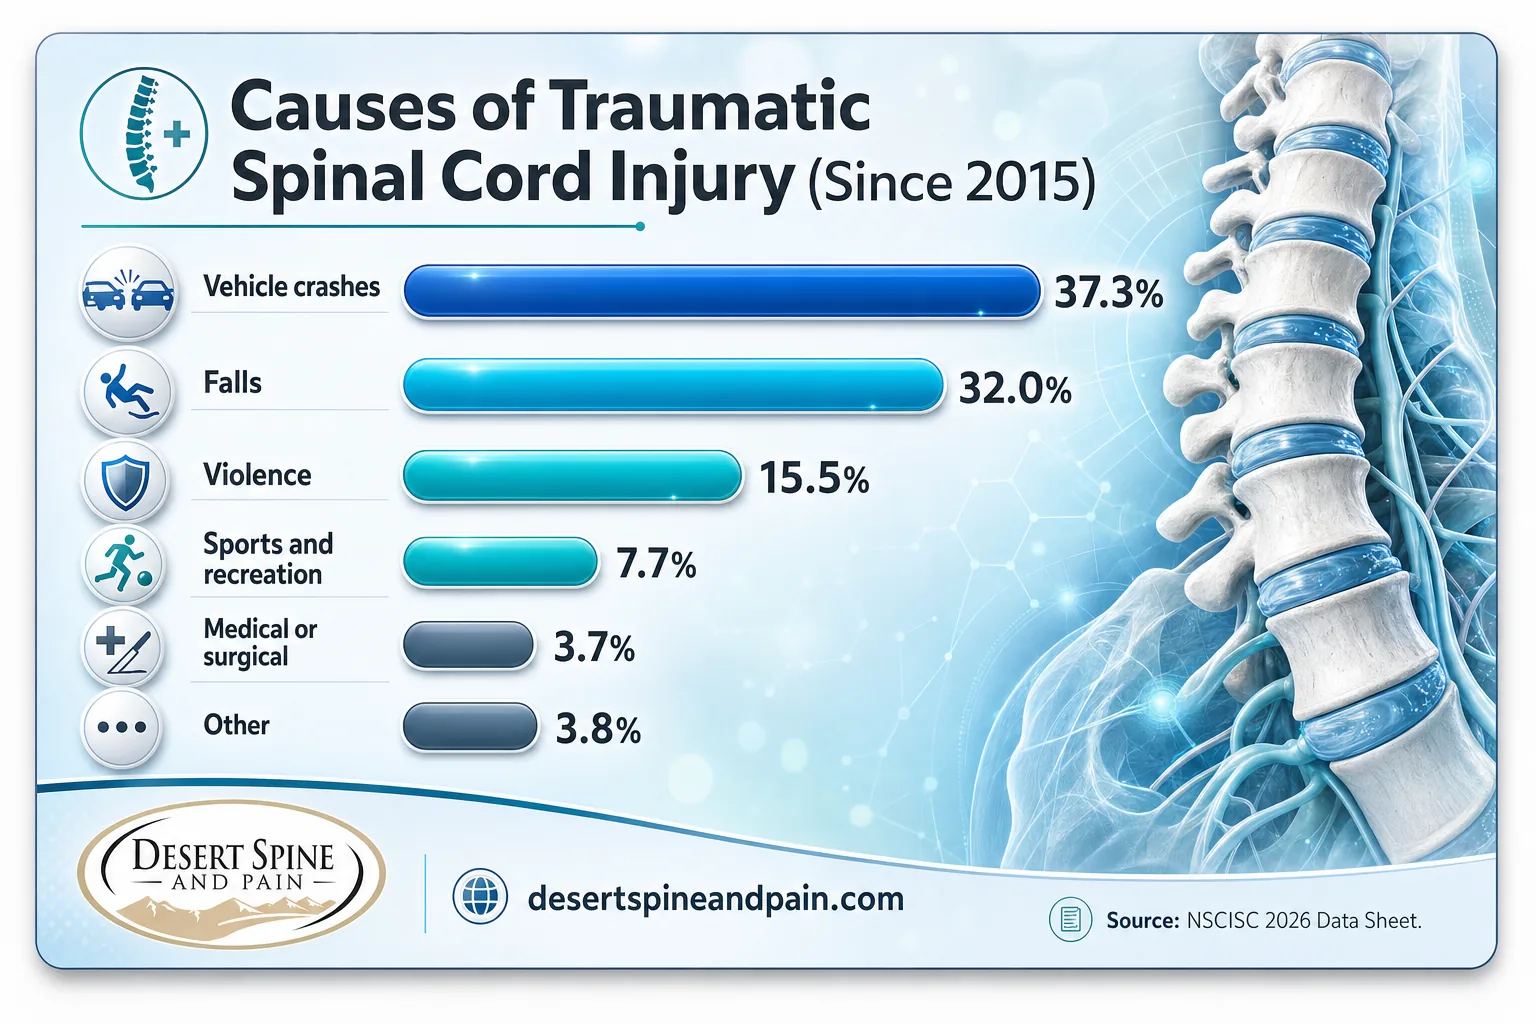
Causes of Traumatic Spinal Cord Injury Since 2015 (% of cases)
Many of these injuries arise from the same events that bring patients to a personal injury attorney: a car accident, a fall on someone else's property, or an act of violence. For attorneys coordinating care for an injured client, understanding the mechanism matters because it shapes both the medical path and the documentation a case requires.
Desert Spine and Pain Analysis: Falls are closing the gap on crashes. Using the NSCISC cause breakdown, falls (32.0%) now sit within 5.3 percentage points of vehicle crashes (37.3%). In the 1970s, crashes dominated by a far wider margin. The convergence tracks the rising average age at injury, since older adults are far more likely to sustain a cord injury from a low-height fall. Calculation and interpretation original to Desert Spine and Pain, derived from NSCISC cause and age-at-injury data.
Source: NSCISC Causes of SCI | World Health Organization
See our spine surgery optionsWho Is Affected: Age, Sex, and Race
Spinal cord injury does not fall evenly across the population. It skews heavily male, disproportionately affects Black Americans relative to their share of the population, and increasingly affects older adults.
| Race/Ethnicity | Share of injuries since 2015 |
|---|---|
| Non-Hispanic White | 55.1% |
| Non-Hispanic Black | 25.1% |
| Hispanic origin | 14.6% |
| Asian | 2.7% |
| Other | 1.9% |
| Native American | 0.6% |
The rising average age at injury is one of the most consequential trends in the data. An injury at 44 carries different rehabilitation, comorbidity, and cost implications than one at 29, and it interacts with the growing share of fall-related injuries described above.
Source: National Spinal Cord Injury Statistical Center
Injury Severity and Neurological Level
Clinicians classify spinal cord injuries by two things: the level on the cord where the damage occurs, and whether the injury is complete or incomplete. Incomplete injuries preserve some signal below the injury site and carry a better outlook for functional recovery.
| Neurological category | Share since 2015 |
|---|---|
| Incomplete tetraplegia | 47.6% |
| Incomplete paraplegia | 20.3% |
| Complete paraplegia | 19.6% |
| Complete tetraplegia | 12.1% |
| Normal (recovered by discharge) | 0.5% |
Myth: a spinal cord injury always means total paralysis. It does not. Most injuries today are incomplete, meaning some sensation or movement remains below the injury level. Incomplete tetraplegia alone accounts for nearly half of all cases. The level and completeness of the injury, not the label "spinal cord injury," determine what recovery is realistic. Every injury is different, which is why individual evaluation matters.
Source: StatPearls, National Library of Medicine
Learn about spinal decompression surgeryRecovery and Rehabilitation Data
Recovery is measured in more than neurological grades. Length of hospital stay, rehabilitation time, and re-hospitalization rates all shape what life after injury looks like, and all have changed markedly since the program began tracking them.
Average Length of Stay: 1970s vs Since 2015 (days)
Shorter stays reflect advances in acute and surgical care, but they also shift more of the recovery burden to outpatient and home settings. Re-hospitalization remains common, most often for genitourinary and skin complications. This is where ongoing specialist follow-up, including interventional pain management, plays a large role in long-term quality of life.
Source: National Spinal Cord Injury Statistical Center
Explore interventional pain managementLifetime Costs and Economic Impact
Spinal cord injury is among the most expensive conditions in medicine to manage over a lifetime. Costs scale sharply with severity and with how young the person is at the time of injury, because younger patients live longer with the condition.
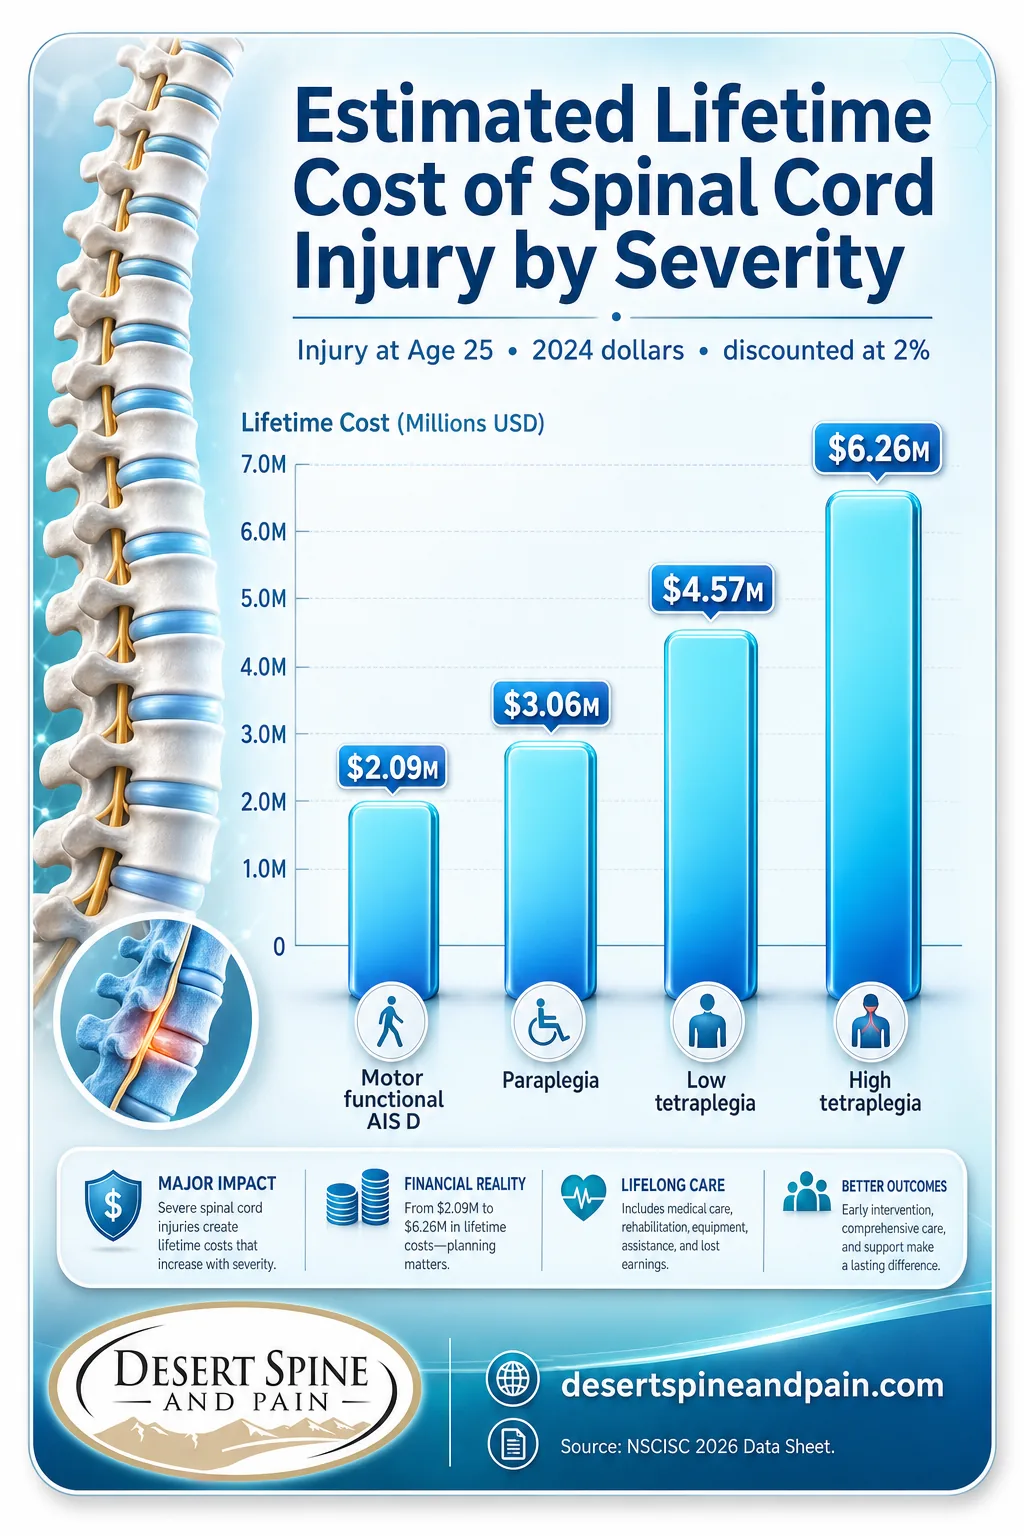
| Severity | First-year cost | Each later year | Lifetime cost at age 25 |
|---|---|---|---|
| High tetraplegia (C1–C4) | $1,410,163 | $244,879 | $6,256,937 |
| Low tetraplegia (C5–C8) | $1,018,966 | $150,222 | $4,571,708 |
| Paraplegia | $687,262 | $91,042 | $3,059,615 |
| Motor functional (AIS D) | $460,224 | $55,900 | $2,090,344 |
These figures matter enormously in personal injury cases, where lifetime cost of care and lost earning capacity are central to a claim. The direct-cost estimates above exclude indirect losses entirely, so the full economic impact on an injured person is larger than any single number suggests.
For personal injury attorneys: Desert Spine and Pain works with attorneys and their clients through the full arc of spine care, with fast response, coordination of documentation, and a surgeon whose evaluation carries weight. When a client's future care and cost picture is central to a case, having a board-certified spine surgeon and neurosurgeon involved early makes a difference.
Source: National Spinal Cord Injury Statistical Center
Spinal Cord Injury Worldwide
The US picture sits inside a much larger global one. The World Health Organization reports that over 15 million people are living with spinal cord injury worldwide, and a 2021 Global Burden of Disease analysis put the figure at about 14.5 million, with the burden rising as populations age.
The WHO stresses that most spinal cord injuries are caused by preventable trauma, including falls, road traffic injuries, and violence. In lower-income countries, limited access to acute and rehabilitative care means outcomes are often worse and the true burden is likely underestimated.
Source: World Health Organization | Global Burden of Disease 2021 analysis
Full Statistics Table
| Statistic | Figure | Source | Year |
|---|---|---|---|
| New US tSCI cases per year | 18,421 | NSCISC | 2026 |
| Annual incidence rate | 54 per million | NSCISC | 2026 |
| People living with tSCI (US) | 308,620 | NSCISC | 2026 |
| Prevalence range | 259,374–393,913 | NSCISC | 2026 |
| Average age at injury | 44 years | NSCISC | 2026 |
| Male share of new injuries | 78% | NSCISC | 2026 |
| Cause: vehicle crashes | 37.3% | NSCISC | 2026 |
| Cause: falls | 32.0% | NSCISC | 2026 |
| Cause: violence | 15.5% | NSCISC | 2026 |
| Cause: sports/recreation | 7.7% | NSCISC | 2026 |
| Incomplete tetraplegia | 47.6% | NSCISC | 2026 |
| Complete neurological recovery by discharge | <1% | NSCISC | 2026 |
| Average acute care stay | 18.6 days | NSCISC | 2026 |
| Average rehab stay | 36.3 days | NSCISC | 2026 |
| Annual re-hospitalization rate | 29% | NSCISC | 2026 |
| Lifetime cost, high tetraplegia at 25 | $6,256,937 | NSCISC | 2026 |
| Lifetime cost, paraplegia at 25 | $3,059,615 | NSCISC | 2026 |
| Average annual indirect cost | $95,309 | NSCISC | 2026 |
| People living with SCI worldwide | 15M+ | WHO | 2024 |
| People living with SCI globally (modeled) | 14.5M | GBD 2021 | 2025 |
Frequently Asked Questions
How many people suffer a spinal cord injury each year?
How many people are living with a spinal cord injury in the US?
What is the leading cause of spinal cord injury?
Can you recover from a spinal cord injury?
How much does a spinal cord injury cost over a lifetime?
Methodology & Sources
All figures in this article trace to primary sources. US incidence, prevalence, demographic, severity, recovery, and cost data come from the National Spinal Cord Injury Statistical Center (NSCISC) 2026 Traumatic Spinal Cord Injury Facts and Figures at a Glance data sheet, published by the University of Alabama at Birmingham in collaboration with the Model Systems Knowledge Translation Center. Clinical cause breakdowns are corroborated by StatPearls (National Library of Medicine). Worldwide figures come from the World Health Organization spinal cord injury fact sheet and a 2021 Global Burden of Disease analysis published in PubMed Central. Cost estimates are expressed in 2024 dollars, discounted at 2% per the NSCISC methodology, and reflect direct costs only unless otherwise noted. This article is informational and is not individual medical advice; anyone dealing with a spine injury should seek evaluation from a qualified specialist.
Media and press: Journalists and researchers are welcome to cite these statistics with attribution to the original primary sources named above, and to Desert Spine and Pain for any analysis labeled as original.



