

Spinal Cord Injury Statistics by State (2026): Regional Data and the Arizona Picture
If you are looking for a clean ranking of spinal cord injuries in all 50 states, the honest answer is that it does not exist. The United States has no complete national state-by-state SCI registry, so state-level data is a patchwork of separate studies. This 2026 reference explains what state data actually exists, why rates vary, and gives an evidence-based estimate of the Arizona picture.
- No complete 50-state ranking exists, because the US lacks a unified national SCI registry.
- State data is a patchwork of individual studies from different years using different methods.
- The national rate is about 54 per million, roughly 18,421 new traumatic injuries a year, the most reliable US baseline.
- Estimated Arizona incidence is about 412 new traumatic injuries a year, applying the national rate to the state population.
- Rates vary for real and artificial reasons: population age and trauma access differ, but so do study methods.
- Arizona skews older, with 19.7% of residents 65 and up, pointing to a higher share of fall-related injuries.
- Beware ranked state tables that present patchwork studies as if they were comparable.
What's in This Guide
Why There's No 50-State Ranking
It is worth stating plainly, because many websites imply otherwise: there is no authoritative, current ranking of spinal cord injury by state. The reason is structural.
The National Spinal Cord Injury Statistical Center maintains the most comprehensive US database, but it draws on a network of Model Systems rehabilitation centers, not a count of every injury in every state. Federal survey data has known problems, including double-counting from repeat hospital admissions and misclassification. As a result, national figures are solid, but clean state-by-state numbers are not available from any single authoritative source.
Myth: you can rank all 50 states by spinal cord injury rate. Any table claiming to do this is almost certainly stitching together studies from different decades that used different definitions and counting methods. Comparing a 1990s Oklahoma study to a 2000s Kentucky study as if they measured the same thing produces misleading rankings. Treat any 50-state SCI ranking with skepticism, and always check the underlying sources and dates.
Source: Global prevalence and incidence of traumatic SCI, PMC
See the national spinal cord injury dataWhat Regional Data Exists
Although there is no unified dataset, individual researchers have measured SCI incidence in specific states and regions over the years. These studies are useful, but only when read as what they are: separate snapshots.
| State or region | What was studied |
|---|---|
| Oklahoma | Traumatic SCI incidence and hospitalization/rehabilitation charges, 1988–1990 |
| Mississippi | SCI incidence using a capture-recapture method |
| Arkansas | Traumatic SCI, 1980–1989 |
| Kentucky / Indiana region | Regional incidence of 27.1 per million per year, 6-year study |
| Utah, Alaska, Alabama, California | State-level incidence studies of varying design |
| Florida, Virginia | Older state central SCI registries |
Notice that the Kentucky and Indiana regional rate of 27.1 per million sits well below the national estimate of about 54 per million. That gap is not necessarily a real geographic difference; it largely reflects differences in how each study defined and captured cases. This is exactly why cross-state comparisons are so treacherous.
Source: Spinal Cord (Nature), regional incidence study
Explore the spine conditions we treatWhy Rates Vary by State
Where genuine state-to-state differences in spinal cord injury do exist, they come from a handful of understandable factors. Separating these real drivers from study-method artifacts is the key to reading state data sensibly.
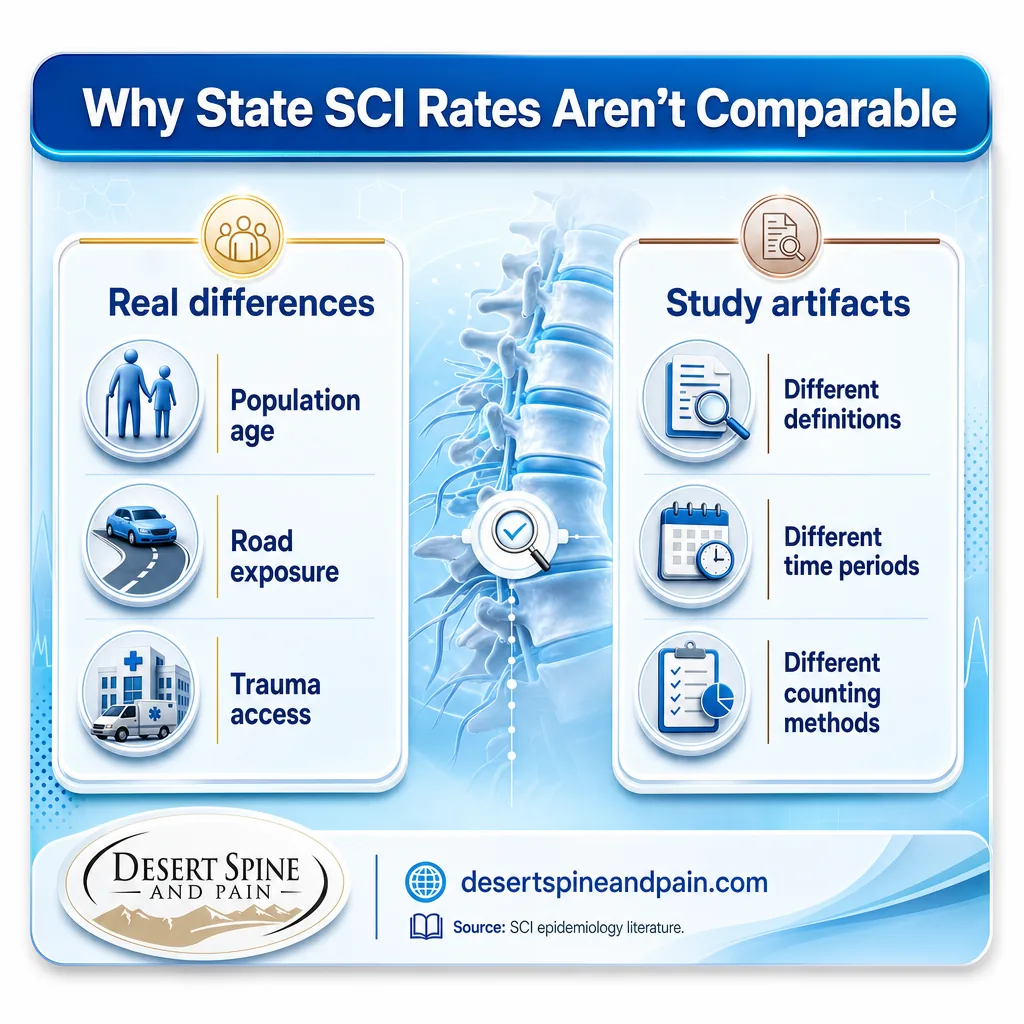
Real drivers of geographic variation:
- Population age: states with older populations see more fall-related injuries.
- Road exposure: rural states with high-speed highway travel can see more crash-related injuries.
- Trauma system access: distance to Level I trauma centers affects both survival and how injuries are recorded.
- Demographics: age and other population factors shape both incidence and injury type.
Artificial drivers (study artifacts):
- Different case definitions of what counts as SCI.
- Different time periods, sometimes decades apart.
- Different counting methods, from registries to hospital records to capture-recapture models.
When a state appears to have an unusually high or low rate, the first question should always be whether the difference is real or an artifact of how the study was done.
Source: Physiopedia epidemiology review
See our spine surgery optionsThe Arizona Picture
Arizona has no measured state-specific SCI rate, but we can build a reasonable estimate by applying the reliable national incidence rate to Arizona's population, and by looking at the state's demographics for clues about injury patterns.
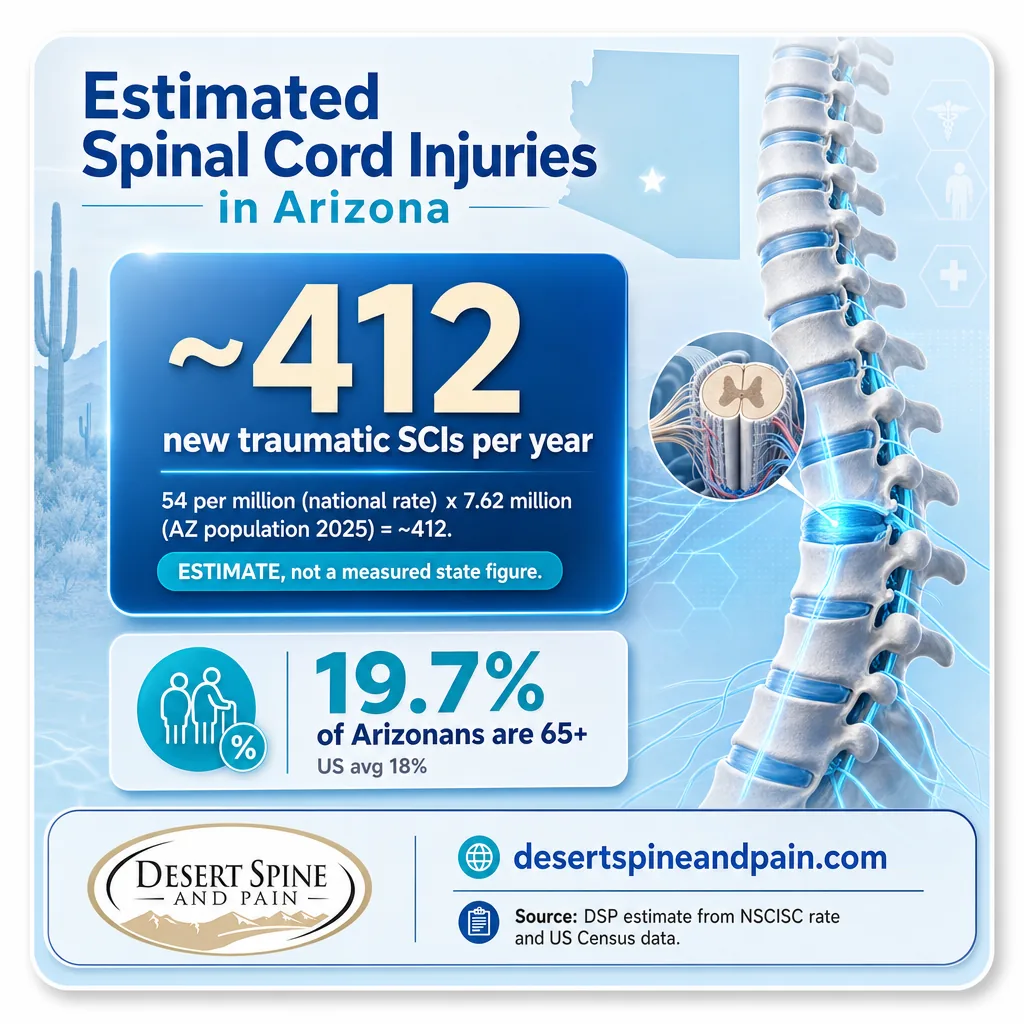
Desert Spine and Pain Analysis: Arizona's age profile points toward fall-related injury. Applying the national 54-per-million rate to Arizona's 7.62 million residents yields roughly 412 new traumatic spinal cord injuries a year. Because 19.7% of Arizonans are 65 or older, above the national 18%, the state's injury mix likely skews more toward falls than the national average, consistent with the broader trend of falls rising as a cause. This is an estimate built from the national rate and state demographics, not a measured Arizona figure. Calculation and interpretation original to Desert Spine and Pain.
Arizona's status as a retirement destination matters here. An older population means more low-energy falls, more osteoporosis-related vulnerability, and more spinal injuries in people who may already have degenerative spine changes, exactly the patients a spine surgeon and neurosurgeon evaluates most often.
Source: USAFacts, Arizona population data | National Spinal Cord Injury Statistical Center
Explore conservative, non-invasive carePhoenix and the Greater Metro
Within Arizona, the Phoenix metro dominates. It already holds the majority of the state's population and is projected to grow further, which concentrates both the population at risk and the demand for specialized spine care.
For patients across Phoenix, Scottsdale, Paradise Valley, Tempe, Mesa, Chandler, Glendale, Peoria, and Surprise, that concentration means access to a spine and neurosurgery practice locally matters. Desert Spine and Pain serves the Greater Phoenix metro from its location at 21001 N Tatum Blvd SUITE 78 1640, Phoenix, AZ 85050, inside BackFit Health + Spine, and also draws patients from outside the area for complex spine surgery.
For personal injury attorneys: Because so much of Arizona's population and highway traffic concentrates in Metro Phoenix, crash-related spine injuries cluster here too. Desert Spine and Pain partners with attorneys and their clients through the full arc of spine care, with fast response and coordination of documentation, led by a board-certified spine surgeon and neurosurgeon.
Source: Arizona Office of Economic Opportunity
Book a consultation with Dr. GreenwaldFull Statistics Table
| Statistic | Figure | Source | Year |
|---|---|---|---|
| Complete 50-state SCI ranking | Does not exist | Epidemiology literature | 2026 |
| National incidence rate | 54 per million | NSCISC | 2026 |
| National new cases per year | 18,421 | NSCISC | 2026 |
| Kentucky/Indiana regional rate | 27.1 per million | Spinal Cord (Nature) | 2001 |
| Estimated Arizona new cases/year | ~412 | DSP estimate | 2026 |
| Arizona population | 7,623,818 | US Census Bureau | 2025 |
| Arizona residents 65+ | 19.7% | US Census / USAFacts | 2024 |
| US residents 65+ (comparison) | 18% | US Census / USAFacts | 2024 |
| Metro Phoenix share of AZ (2060 proj.) | 73.5% | Arizona OEO | 2025 |
| States with individual SCI studies | OK, MS, AR, UT, AK, AL, CA | Epidemiology literature | various |
| Older state registries | Florida, Virginia | Epidemiology literature | historical |
| Highest reported US regional prevalence | 906 per million | Systematic review | 2024 |
| Reason rates vary (real) | Age, roads, trauma access | Epidemiology literature | 2026 |
| Reason rates vary (artifact) | Definitions, methods, era | Epidemiology literature | 2026 |
| Most reliable US baseline | National, not state, figures | NSCISC | 2026 |
Frequently Asked Questions
Is there a spinal cord injury ranking of all 50 states?
How many spinal cord injuries happen in Arizona each year?
Why do spinal cord injury rates vary by state?
Which states have spinal cord injury data?
Does Arizona have a higher spinal cord injury risk?
Methodology & Sources
The national incidence rate and new-case figures come from the National Spinal Cord Injury Statistical Center (NSCISC). The finding that no complete national state registry exists, and the regional studies cited (Oklahoma, Mississippi, Arkansas, Utah, Alaska, Alabama, California, and the Florida and Virginia registries), come from a peer-reviewed systematic review of SCI incidence and prevalence in PubMed Central and a regional incidence study published in Spinal Cord (Nature), which reported the 27.1-per-million Kentucky and Indiana figure. The highest reported US regional prevalence of 906 per million is from a systematic review summarized by Physiopedia. Arizona population figures come from the US Census Bureau, reported via USAFacts, and Metro Phoenix projections come from the Arizona Office of Economic Opportunity. The estimated Arizona annual incidence of about 412 is an original Desert Spine and Pain calculation applying the national 54-per-million rate to the 2025 Arizona population; it is an estimate, not a measured state figure. This article is informational and is not individual medical advice; anyone with spine symptoms or a suspected injury should seek evaluation from a qualified specialist.
Media and press: Journalists and researchers are welcome to cite these statistics with attribution to the original primary sources named above, and to Desert Spine and Pain for any analysis or estimate labeled as original.



