
Spinal Cord Injury Causes Statistics (2026): Trends, Age Patterns, and Prevention Data
Vehicle crashes and falls together cause nearly 70% of all traumatic spinal cord injuries in the US, but the fuller story is in the details: who each cause affects, and how the pattern has shifted over 50 years. This 2026 reference breaks down the causes of spinal cord injury by mechanism, by age and sex, and by activity, using data from the National Spinal Cord Injury Statistical Center and peer-reviewed research.
- Vehicle crashes (37.3%) are the leading cause, followed by falls (32.0%), violence (15.5%), and sports (7.7%).
- Falls have risen steadily since 1973, while sports injuries have been decreasing and violence peaked in the early 1990s.
- Falls dominate in older adults, causing the majority of spinal cord injuries in people aged 65 and older.
- Young males skew toward crashes and violence, reflecting exposure to higher-risk activities earlier in life.
- Among sports injuries, cycling leads at about 81% of sports-related traumatic spine injuries in one large trauma database.
- Non-traumatic causes are rising as tumors and degenerative disease affect an aging population.
- Most traumatic causes are preventable, which is why prevention data matters as much as the injury data itself.
What's in This Guide
The Leading Causes
The National Spinal Cord Injury Statistical Center tracks the cause of every traumatic injury reported to its database. Since 2015, four mechanisms account for the overwhelming majority of cases.
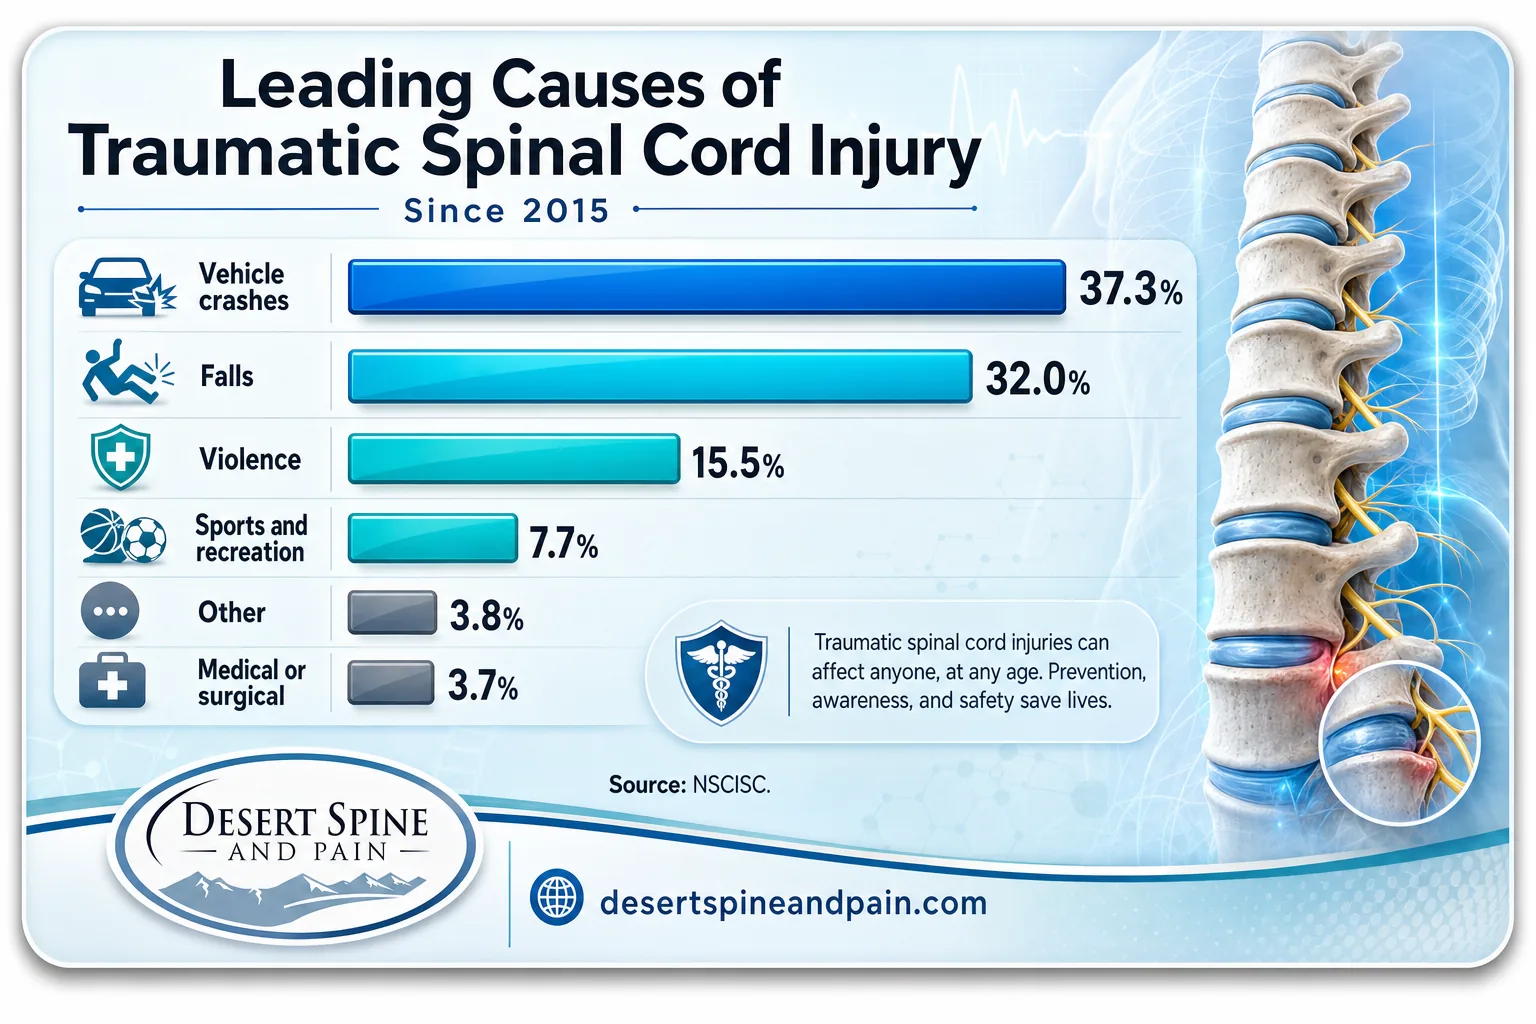
Leading Causes of Traumatic Spinal Cord Injury Since 2015 (% of cases)
These are the headline numbers, and they hold across the population as a whole. But a single average hides how sharply the causes differ by age, sex, and activity, which is where the rest of this breakdown goes. For the broader demographic and outcome picture, see our full spinal cord injury statistics.
Source: NSCISC FAQ
Explore the spine conditions we treatHow Causes Have Changed Over Time
The distribution of causes is not fixed. The NSCISC has tracked injuries since the early 1970s, and three long-run trends stand out.
The rise in falls is the defining shift. It tracks the increase in average age at injury, from 29 in the 1970s to 44 today, and it is why fall prevention has become central to reducing spinal cord injuries. The decline in sports injuries partly reflects successful rule changes, such as the 1970s ban on head-first tackling in American football, which sharply cut cervical injuries in that sport.
Desert Spine and Pain Analysis: The cause mix is aging in place. Two NSCISC trends move together: falls rising steadily since 1973, and average age at injury climbing from 29 to 44. As the injured population gets older, low-energy falls replace high-energy crashes as the growth driver. The implication is that spinal cord injury is increasingly a condition of older adults with pre-existing spinal degeneration, not only of young people in accidents. Calculation and interpretation original to Desert Spine and Pain, derived from NSCISC cause-trend and age-at-injury data.
Source: NSCISC FAQ
See our spine surgery optionsCauses by Age and Sex
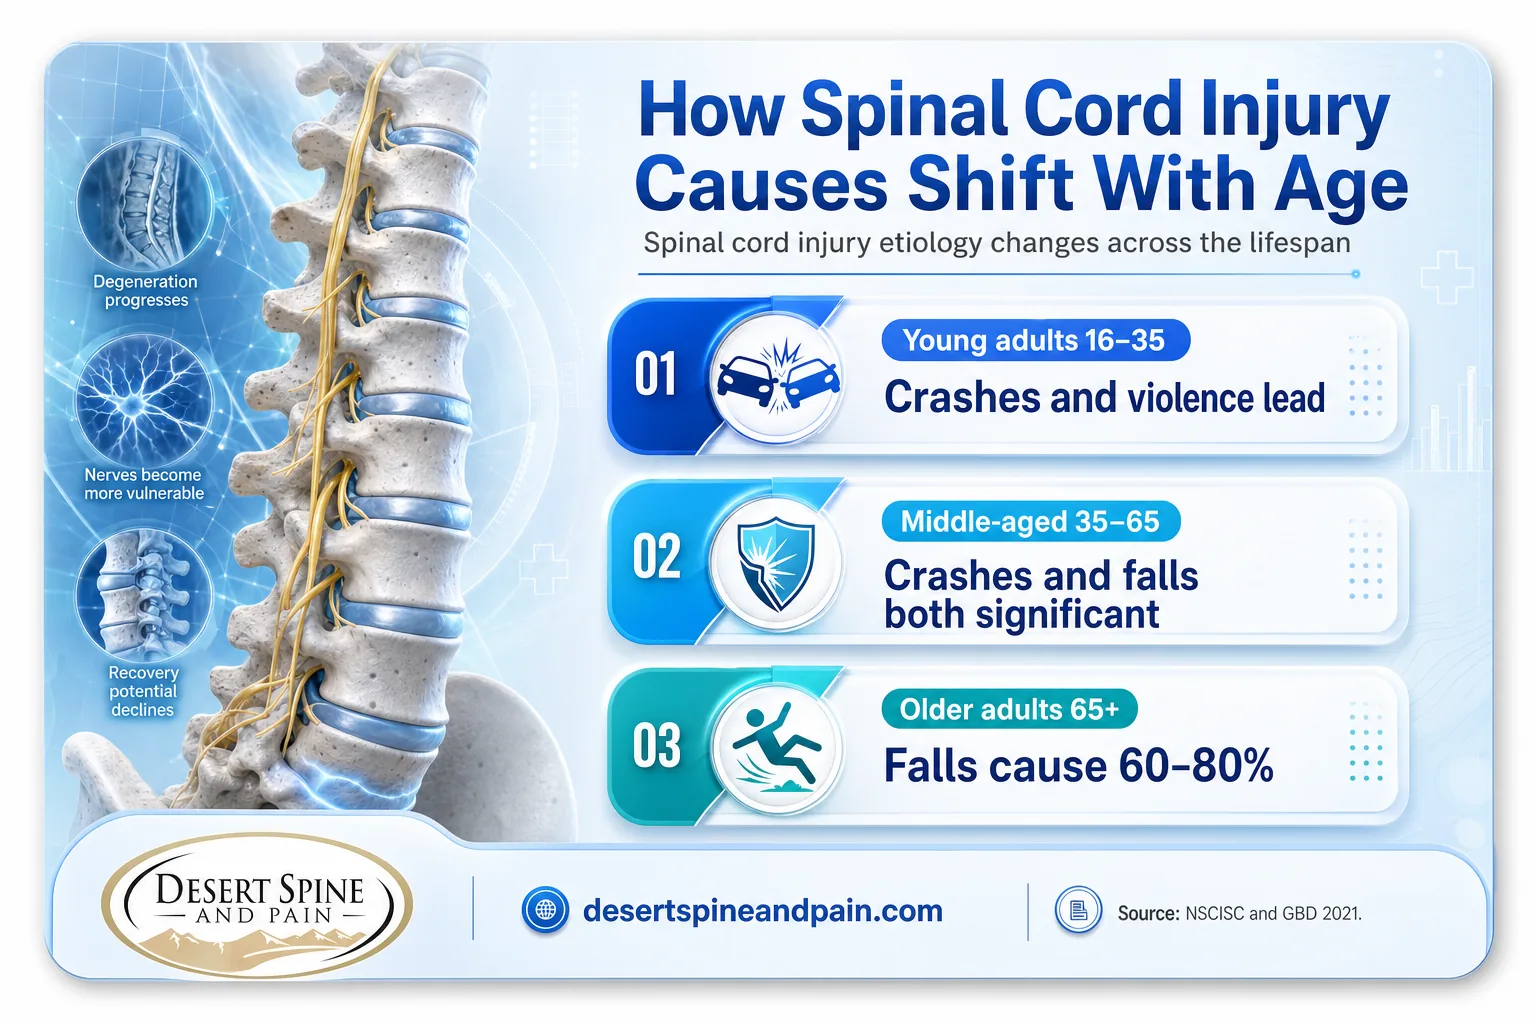
The single most important thing the averages hide is how completely the leading cause flips with age. Among younger adults, crashes and violence dominate. Among older adults, falls take over almost entirely.
| Age group | Dominant cause pattern |
|---|---|
| Young adults (roughly 16–35) | Vehicle crashes and violence lead; higher-energy mechanisms |
| Middle-aged (roughly 35–65) | Transitional: crashes and falls both significant |
| Older adults (65+) | Falls dominate, often from standing height, tied to osteoporosis and balance |
Postmenopausal bone loss makes older women particularly vulnerable to fall-related vertebral fractures and spinal cord injury, while younger men are overrepresented in crashes, violence, and high-risk work. These patterns matter clinically, because a low-energy fall in an older adult with a degenerated spine presents very differently from a high-speed crash in a young adult.
Source: Global Burden of Disease 2021 analysis | StatPearls, National Library of Medicine
Explore conservative, non-invasive careSports and Recreation Breakdown
Sports and recreation cause a smaller share of injuries overall, but the sub-pattern within that category is striking, and it is not what most people expect.
Beyond raw frequency, certain activities carry disproportionate risk of the most severe injuries. Systematic reviews consistently identify diving, skiing, rugby, and horseback riding as high-risk for spinal cord injury, with diving and contact sports especially associated with cervical injuries. Water sports and diving stand out because head-first entry into shallow water is a classic mechanism for complete cervical injury.
Myth: sports are a leading cause of spinal cord injury. At 7.7% of cases, sports rank fourth, well behind crashes and falls, and the share has been declining for decades. The risk is real for specific high-risk activities like diving and skiing, but the popular image of sports as a top cause overstates it. Prevention efforts are most impactful where the numbers actually concentrate: crashes and falls.
Source: National Trauma Data Bank analysis, PMC | Systematic review of sport-related SCI, PMC
Learn about cervical and lumbar fusionNon-Traumatic Causes
Not all spinal cord injuries are traumatic. A growing share arises from internal causes, and these are increasing as the population ages.
Non-traumatic spinal cord injury can result from tumors (both primary spinal tumors and metastases), infections such as epidural abscesses or spinal osteomyelitis, degenerative conditions like severe spinal stenosis and spondylosis, and vascular events. Unlike trauma, these develop over time and often present gradually, which changes both the diagnostic approach and the treatment window. Degenerative spinal disease in particular can slowly narrow the spinal canal until even minor trauma triggers injury.
Why this matters for care: Degenerative and compressive causes are exactly the conditions a spine surgeon and neurosurgeon evaluates and treats, from decompression for stenosis to tumor-related cord compression. Recognizing a non-traumatic cause early, before it becomes an emergency, is one of the strongest arguments for prompt specialist evaluation of persistent spine symptoms.
Source: World Health Organization | StatPearls, National Library of Medicine
Learn about stenosis surgeryPrevention and What the Data Implies
The World Health Organization emphasizes that most traumatic spinal cord injuries are preventable, and the cause data points directly at where prevention works.
Where the cause data points for prevention:
- Crashes: road infrastructure, vehicle safety, seatbelt use, and reducing impaired and distracted driving.
- Falls: home fall-proofing, balance training, and osteoporosis screening and treatment, especially for adults over 65.
- Violence: firearm safety and violence-reduction policy.
- Sports: rule enforcement and technique for high-risk activities like diving and contact sports.
For the individual, the practical takeaway is that the two causes worth worrying about most, crashes and falls, are also the two most within reach of everyday prevention. And when an injury does occur, the level, mechanism, and speed of expert evaluation shape everything that follows.
Source: World Health Organization
Book a consultation with Dr. GreenwaldFull Statistics Table
| Statistic | Figure | Source | Year |
|---|---|---|---|
| Cause: vehicle crashes | 37.3% | NSCISC | 2026 |
| Cause: falls | 32.0% | NSCISC | 2026 |
| Cause: violence | 15.5% | NSCISC | 2026 |
| Cause: sports/recreation | 7.7% | NSCISC | 2026 |
| Cause: medical/surgical | 3.7% | NSCISC | 2026 |
| Cause: other | 3.8% | NSCISC | 2026 |
| Crashes + falls combined | ~69% | NSCISC | 2026 |
| Falls among adults 65+ | 60–80% | GBD 2021 | 2025 |
| Male share of new injuries | 78% | NSCISC | 2026 |
| Falls trend since 1973 | Rising steadily | NSCISC | 2026 |
| Violence trend | Peaked early 1990s, declined | NSCISC | 2026 |
| Sports trend | Decreasing | NSCISC | 2026 |
| Sports SCI: cycling share | 81% | NTDB study | 2022 |
| Sports SCI: ski/snowboard share | 12% | NTDB study | 2022 |
| Sports TSI involving cord | 14.9% | NTDB study | 2022 |
| Non-traumatic causes trend | Rising with aging | WHO | 2024 |
Frequently Asked Questions
What is the number one cause of spinal cord injury?
How have the causes of spinal cord injury changed over time?
What causes spinal cord injuries in older adults?
Which sports cause the most spinal cord injuries?
What is the difference between traumatic and non-traumatic causes?
Methodology & Sources
Leading-cause percentages and long-run cause trends come from the National Spinal Cord Injury Statistical Center (NSCISC), including its Facts and Figures data sheet and public FAQ, published by the University of Alabama at Birmingham. Age-specific fall data comes from a 2021 Global Burden of Disease analysis published in PubMed Central. Sports-related sub-breakdowns come from a peer-reviewed analysis of the US National Trauma Data Bank and a systematic review of sport-related spinal cord injury, both published in PubMed Central. Non-traumatic cause information follows the World Health Organization spinal cord injury fact sheet and StatPearls (National Library of Medicine). Cause percentages reflect injuries reported since 2015 unless otherwise noted. This article is informational and is not individual medical advice; anyone with spine symptoms or a suspected injury should seek evaluation from a qualified specialist.
Media and press: Journalists and researchers are welcome to cite these statistics with attribution to the original primary sources named above, and to Desert Spine and Pain for any analysis labeled as original.



