
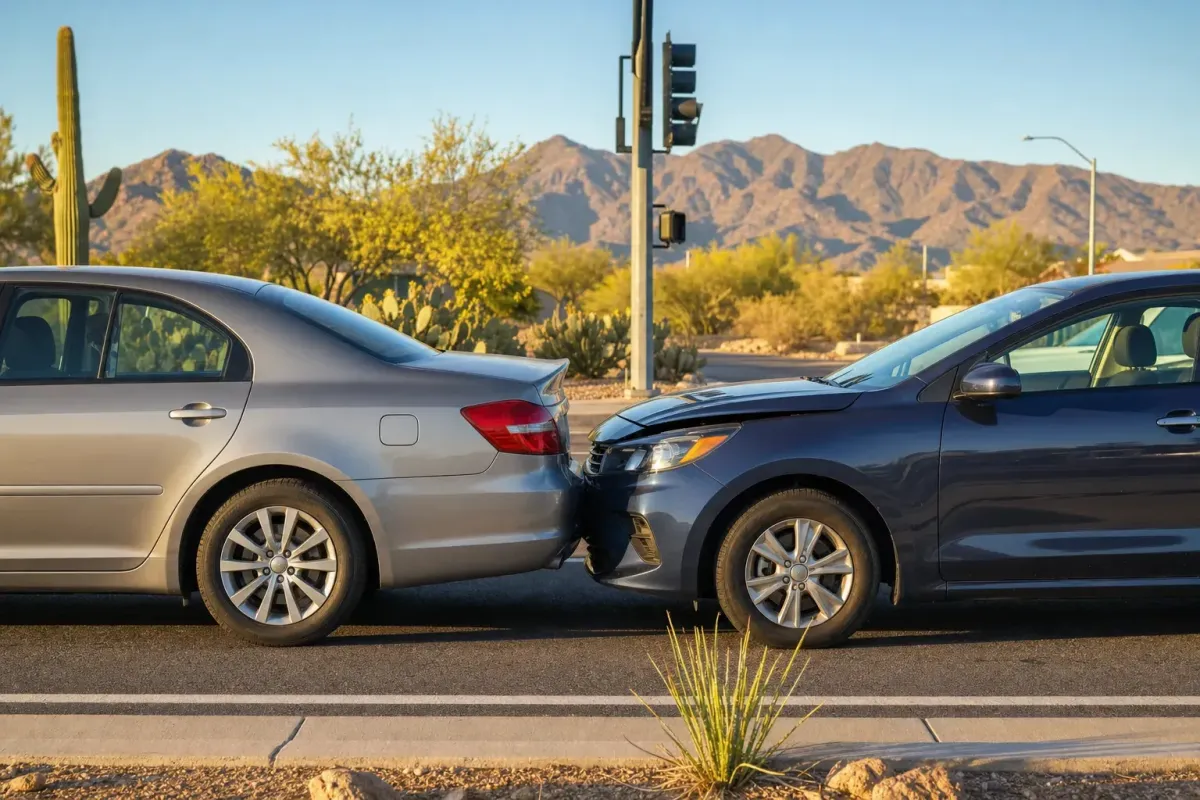
Rear-End Collision Injury Statistics (2026): The Most Common Crash and Its Toll
Rear-end collisions are the single most common type of crash in the United States, and despite their reputation as harmless fender benders, they cause more injuries than any other crash type. They also produce the injuries a spine practice sees most: whiplash accounts for an estimated 65 percent of rear-end injury claims. This report breaks down the data on how common these crashes are and why they hurt people.
- Rear-end crashes are the most common crash type, roughly 29 percent of all crashes and by some estimates more than a third.
- Federal sources report between about 1.7 and 2.5 million rear-end crashes a year in the U.S.
- They cause the highest injury total of any single crash type, an estimated 500,000 to 950,000 injuries annually.
- Whiplash accounts for about 65 percent of bodily injury claims from rear-end crashes; lower back injuries are second.
- In most rear-end crashes the lead vehicle is stopped or slowing, so the struck occupant cannot brace or evade.
- Injuries occur even at 5 to 8 mph, because the neck absorbs force the body cannot prepare for.
What's in This Report
1 The Most Common Crash Type
No crash happens more often than the rear-end collision. Federal crash data consistently ranks it first, ahead of every other configuration, and the totals are enormous.
The National Highway Traffic Safety Administration attributes roughly 29 percent of all crashes to rear-end impacts, and some analyses place the figure at more than a third of all collisions. In raw numbers, federal sources have reported between about 1.7 and 2.5 million rear-end crashes per year in the United States. Whatever the exact figure in a given year, the conclusion is the same: rear-end crashes are the defining crash of American roads.
These crashes are the classic mechanism behind the injury covered in our report on whiplash injury data, which is why the two topics are so closely linked.

Source: Rear-end bodily injury claim composition | NIH StatPearls, Motor Vehicle Collisions
Learn how we evaluate whiplash and neck injuries
4 Why Rear-End Crashes Injure So Reliably
The reason rear-end crashes injure the neck and spine so consistently comes down to a single factor: the person who gets hurt almost never sees it coming.
In the majority of rear-end crashes, the lead vehicle is stationary or slowing, stopped at a light, in traffic, or at a stop sign. Federal data indicates the lead vehicle is stationary at least twice as often as it is moving. That means the struck occupant typically has no opportunity to brace, tense their muscles, or make an evasive maneuver. The body is caught relaxed and unprepared, and the sudden acceleration-deceleration throws the head backward and then forward while the torso is pushed ahead by the seat. The neck absorbs a force it had no chance to prepare for.
This is also why low-speed rear-end crashes cause real injury. Laboratory crash tests and clinical studies document cervical injuries at impact speeds as low as 5 to 8 miles per hour. The forces that injure an unprepared neck are simply not the same as the forces that visibly damage a car.
Combine two facts from the data: the lead vehicle is stopped in most rear-end crashes, and whiplash makes up about 65 percent of the resulting injury claims. Together they explain why rear-end crashes are the single most reliable producer of neck injury among all crash types. The absence of bracing is not a minor detail; it is the mechanism. It also explains the frequent delayed onset of symptoms, since an unprepared soft-tissue injury often inflames over the following days.
Calculation and interpretation original to Desert Spine and Pain.
Source: Low-speed rear-end injury mechanism | NIH, Crash Reconstruction and Whiplash
5 What Causes Rear-End Crashes
Unlike some crash types, rear-end collisions trace to a short and preventable list of causes. Nearly all of them come down to a following driver who could not stop in time.
Distracted driving leads the list, with texting and phone use topping the causes of a driver failing to notice stopped traffic ahead. Following too closely, or tailgating, removes the reaction distance needed to stop safely. Speeding shortens that window further, and impairment and drowsiness slow the reactions that would otherwise avoid the crash. Weather and sudden stops complete the picture. Notably, the addition of the center high-mounted stop lamp in the 1980s reduced rear-end crashes by only about 4 percent, a reminder that vehicle technology alone has not solved the problem.
- Distracted driving: texting and phone use are the top contributors.
- Following too closely: eliminates safe stopping distance.
- Speeding: shortens reaction and braking time.
- Impairment and drowsiness: slow the reactions that avoid a crash.
- Sudden stops and weather: reduce the margin for error.
Source: Rear-end collision causation data
6 Liability and What to Do
For the personal injury attorneys whose clients make up much of any spine practice's crash caseload, rear-end crashes have a distinctive feature: liability is often clearer than in other crash types.
Because drivers are expected to maintain a safe following distance and to be able to stop for the vehicle ahead, the rear driver is frequently found at fault. And because the lead vehicle is stationary in most of these crashes, the factual picture is often simpler than in intersection or multi-vehicle collisions. This does not make any case automatic; fault always depends on the specific circumstances, and comparative fault can apply. But the combination of clear mechanism and common stationary-lead scenario means rear-end injury claims often rest heavily on the medical evidence rather than on disputed liability.
That places the emphasis squarely on accurate diagnosis and documentation, exactly where a spine specialist adds value. Because rear-end injuries frequently have delayed symptoms, early evaluation both protects the patient's recovery and establishes the medical record a claim depends on.
How Desert Spine and Pain fits in
Desert Spine and Pain is led by Dr. David L. Greenwald, a board-certified surgeon who is both a spine surgeon and a neurosurgeon. That dual expertise is well matched to rear-end injuries, which concentrate in the neck and spine and occasionally involve the nerves. The practice pursues the least invasive effective treatment first and reserves surgery for cases that require it. For personal injury attorneys across the Phoenix area, it offers 24/7 concierge coordination, fast response, and the clear documentation their clients' claims depend on.
Book a consultation or connect our team with your attorney
Source: Rear-end liability and comparative fault overview
7 Summary Data Table
| Statistic | Figure | Source | Year |
|---|---|---|---|
| Rear-end share of all crashes | ~29% | NHTSA | Cited |
| Rear-end share (some analyses) | >33% | NTSB / DOT | Cited |
| Rear-end crashes per year (U.S.) | 1.7-2.5 million | NTSB / DOT | Cited |
| Injuries per year | 500,000-950,000 | NHTSA CRSS / NTSB | Cited |
| Share of all crash injuries | ~29-31% | NHTSA / Forbes | Cited |
| Share of serious-injury crashes | ~29% | Published study | Cited |
| Deaths per year | 2,000-2,500 | IIHS / NHTSA | Cited |
| Share of all traffic fatalities | ~7% | Insurance Information Institute | Cited |
| Whiplash share of rear-end injury claims | ~65% | Compiled crash analysis | 2025 |
| Second most common injury | Lower back (strain/disc) | Compiled crash analysis | 2025 |
| Lead vehicle stationary vs moving | ≥2 to 1 | U.S. DOT | Cited |
| Minimum injury-causing impact speed | 5-8 mph | Crash-test / clinical studies | Cited |
| Annual whiplash cases (U.S., mostly rear-end) | ~3 million | Compiled crash analysis | 2025 |
| CHMSL reduction in rear-end crashes | ~4% | NHTSA | Cited |
| Most common cause | Distracted driving | NHTSA | Cited |
Frequently Asked Questions
How common are rear-end collisions?
What is the most common injury in a rear-end collision?
How many injuries do rear-end collisions cause each year?
Why are rear-end collisions so likely to cause injury?
Who is at fault in a rear-end collision?
All figures trace to their most authoritative available source. Crash-frequency, injury, and fatality data are drawn from the National Highway Traffic Safety Administration, the National Transportation Safety Board, the U.S. Department of Transportation, the Insurance Institute for Highway Safety, and the Insurance Information Institute, as compiled in current crash analyses. Injury-claim composition and the whiplash share reflect compiled bodily-injury claim data. Low-speed injury thresholds come from crash-test and clinical research. Because federal sources report rear-end frequency and injury totals across different years and databases, this report presents ranges rather than single figures where the sources vary. Where Desert Spine and Pain interprets the combined data, that analysis is labeled as original.



