

Whiplash Injury Statistics (2026): Prevalence, Recovery, and What the Data Shows
Whiplash is the most common crash injury and one of the most misunderstood. Roughly 2.3 million people experience whiplash each year in the United States, yet it is routinely dismissed as minor, even though peer-reviewed research shows about a quarter of cases become chronic. This report breaks down the data on how common whiplash is, who is most at risk, and what recovery actually looks like.
- Roughly 2.3 million whiplash injuries are reported in the U.S. each year, about a quarter of all crash injuries.
- Women face 2 to 3 times the risk of men, and people aged 30 to 50 are most affected.
- About 50 percent recover in 3 to 6 months, but peer-reviewed data shows roughly 25 percent transition to chronic pain and disability.
- Up to half report lingering symptoms, and around 10 percent experience permanent symptoms.
- Whiplash occurs at speeds as low as 5 miles per hour; symptom severity does not track vehicle damage.
- Early, active care is linked to better outcomes than rest, making prompt evaluation valuable.
What's in This Report
1 How Common Whiplash Is
Whiplash is a neck injury caused by rapid back-and-forth motion of the head, like the crack of a whip, most often in rear-end collisions. It is the single most frequently reported injury from car crashes, and the numbers are substantial.
Roughly 2.3 million people experience whiplash each year in the United States, and it is commonly estimated to account for about 25 percent of all car accident injuries. While rear-end collisions are the classic cause, whiplash can also result from side impacts, sudden deceleration, falls, and contact sports. It is, in short, one of the most common musculoskeletal injuries in the country.
Whiplash sits at the top of the crash injury frequency list, ahead of the disc and structural injuries covered in our report on car accident back injury data. Its very commonness is part of why it is underestimated.
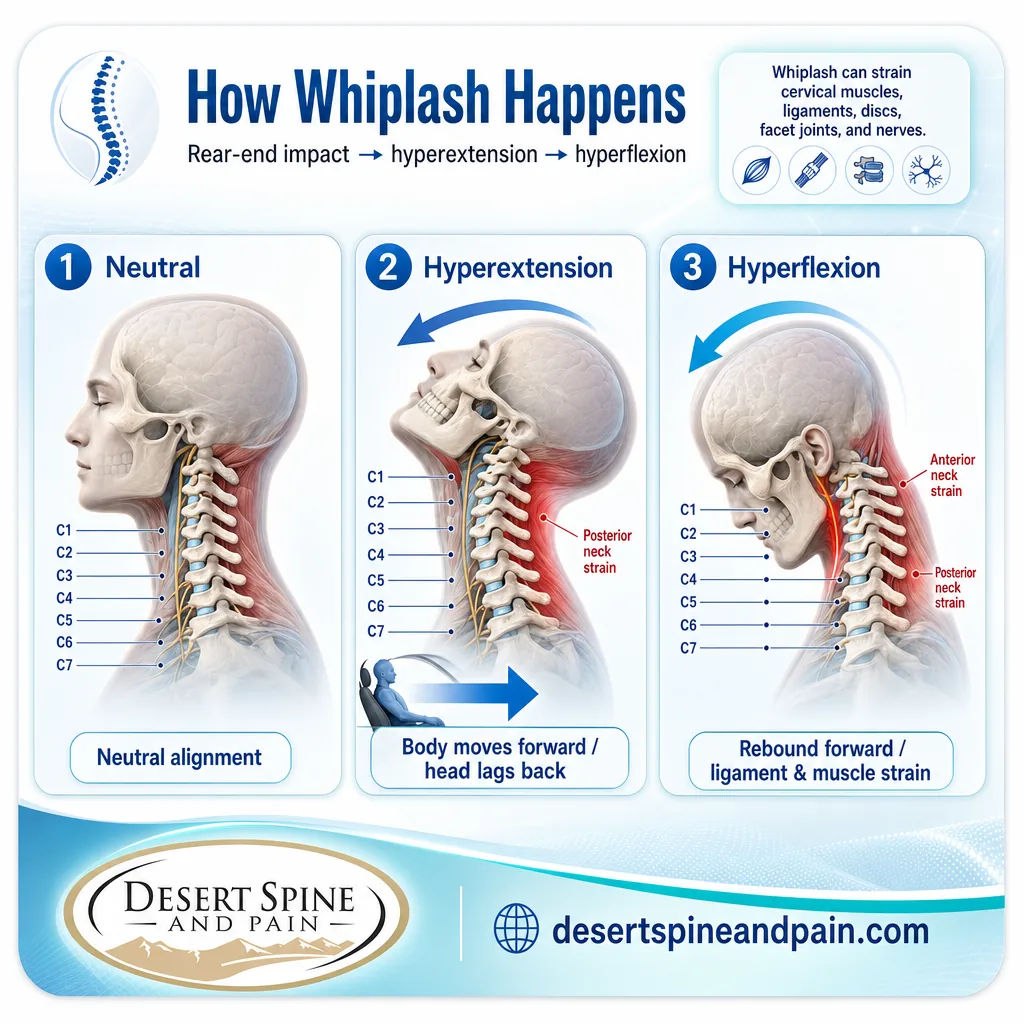
Source: Whiplash prevalence data (commonly cited CDC-attributed figures)
2 Who Is Most at Risk
Whiplash does not affect everyone equally, and the risk pattern is well established. Two factors stand out: sex and age.
Women are consistently found to be 2 to 3 times more susceptible to whiplash than men. The leading explanation is anatomical, differences in neck musculature and geometry that affect how the head and neck respond to sudden force. The most affected age group is 30 to 50 years old, though whiplash occurs across the age span, and research suggests children face roughly two-thirds the risk of adults. General-population studies give a sense of how widespread chronic whiplash becomes: the whiplash condition has been reported in about 2.9 percent of the Danish general population and 1.2 percent in Japan.
Whiplash Risk Factors
Source: National Institutes of Health, WAD Prevalence Cohort Study
3 Recovery Rates and Chronic Whiplash
This is where the data most sharply contradicts the "minor injury" label, and where the peer-reviewed research is most valuable. Recovery from whiplash is genuinely bimodal: many people get better quickly, and a substantial minority do not.
The encouraging half of the picture is that more than 50 percent of those injured should expect to recover relatively rapidly, typically within three to six months. The concerning half is that peer-reviewed longitudinal research finds approximately 25 percent of people injured in a crash transition from acute to chronic pain and disability, and that up to 50 percent of acutely injured people fail to fully recover. Around 10 percent report permanent symptoms. One clinical marker stands out: poor recovery is strongly associated with little-to-no improvement by the three-month mark.
Applying the roughly 25 percent chronic-transition rate to the approximately 2.3 million annual whiplash injuries implies on the order of half a million people a year in the U.S. moving from an acute neck injury into chronic pain and disability. Whatever the precise figure, the scale makes clear that whiplash is not a trivial, self-resolving problem for a large share of those affected, and that the three-month window is a meaningful checkpoint for escalating care.
Calculation and interpretation original to Desert Spine and Pain.
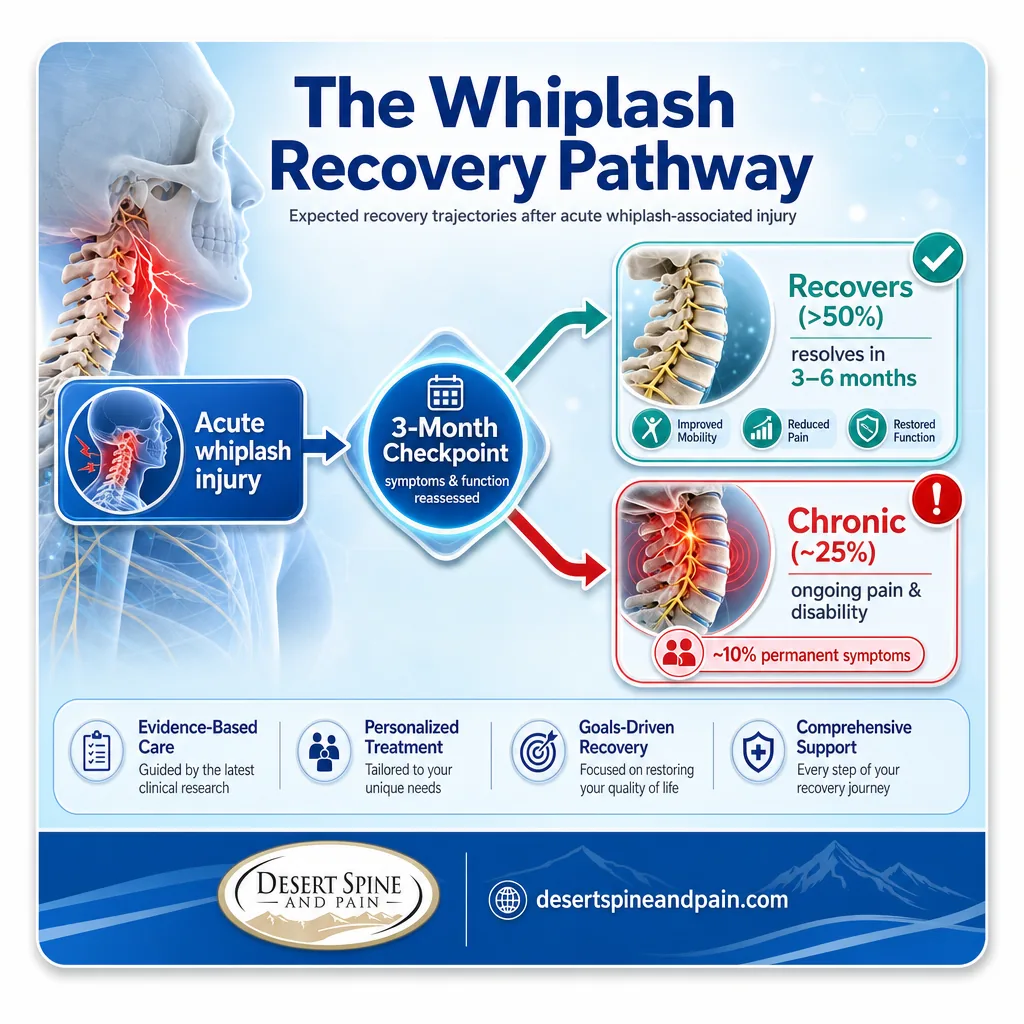
Source: National Institutes of Health, Whiplash Recovery Heterogeneity Study | NIH, Chronic WAD Disability Data
Learn how we evaluate and treat whiplash
4 The Low-Speed Myth
Perhaps no belief about whiplash causes more harm than the assumption that a low-speed crash cannot produce a real injury. The research directly contradicts it.
Studies have documented whiplash symptoms lasting more than six months from crashes with speed changes as low as 8 kilometers per hour, roughly 5 miles per hour. At the same time, some individuals in crashes with much larger speed changes escaped without lasting symptoms. The lesson is that whiplash outcomes do not scale neatly with crash severity or vehicle damage. A minor-looking collision with little bumper damage can still transmit enough force to the neck to cause a genuine, lasting injury.
This is one of the most persistent and costly misconceptions about crashes. The forces that injure the neck are not the same as the forces that dent a bumper. Modern vehicles are engineered to absorb and resist low-speed impact, which can actually transmit more force to the occupant. Symptom severity and vehicle damage are only loosely related, which is why a "minor" crash deserves evaluation if symptoms appear.
Source: NIH, Crash Reconstruction and Whiplash Recovery
5 Understanding WAD Grades
Clinicians classify whiplash using the Quebec Task Force system of whiplash-associated disorders, or WAD, which runs from grade 0 to grade 4. Understanding the scale helps make sense of why experiences vary so widely.
- WAD 0: no neck complaint, no physical signs.
- WAD 1: neck pain, stiffness, or tenderness, but no physical signs on exam.
- WAD 2: neck complaint plus musculoskeletal signs such as reduced range of motion and point tenderness.
- WAD 3: neck complaint plus neurological signs such as weakness, sensory changes, or reduced reflexes.
- WAD 4: neck complaint with fracture or dislocation, the most severe category.
Most crash whiplash falls into grades 1 and 2, but grades 3 and 4 involve neurological or structural injury and require prompt specialist evaluation. The grade at presentation, along with symptom severity and how the person is doing at three months, helps guide the treatment plan and set expectations for recovery.
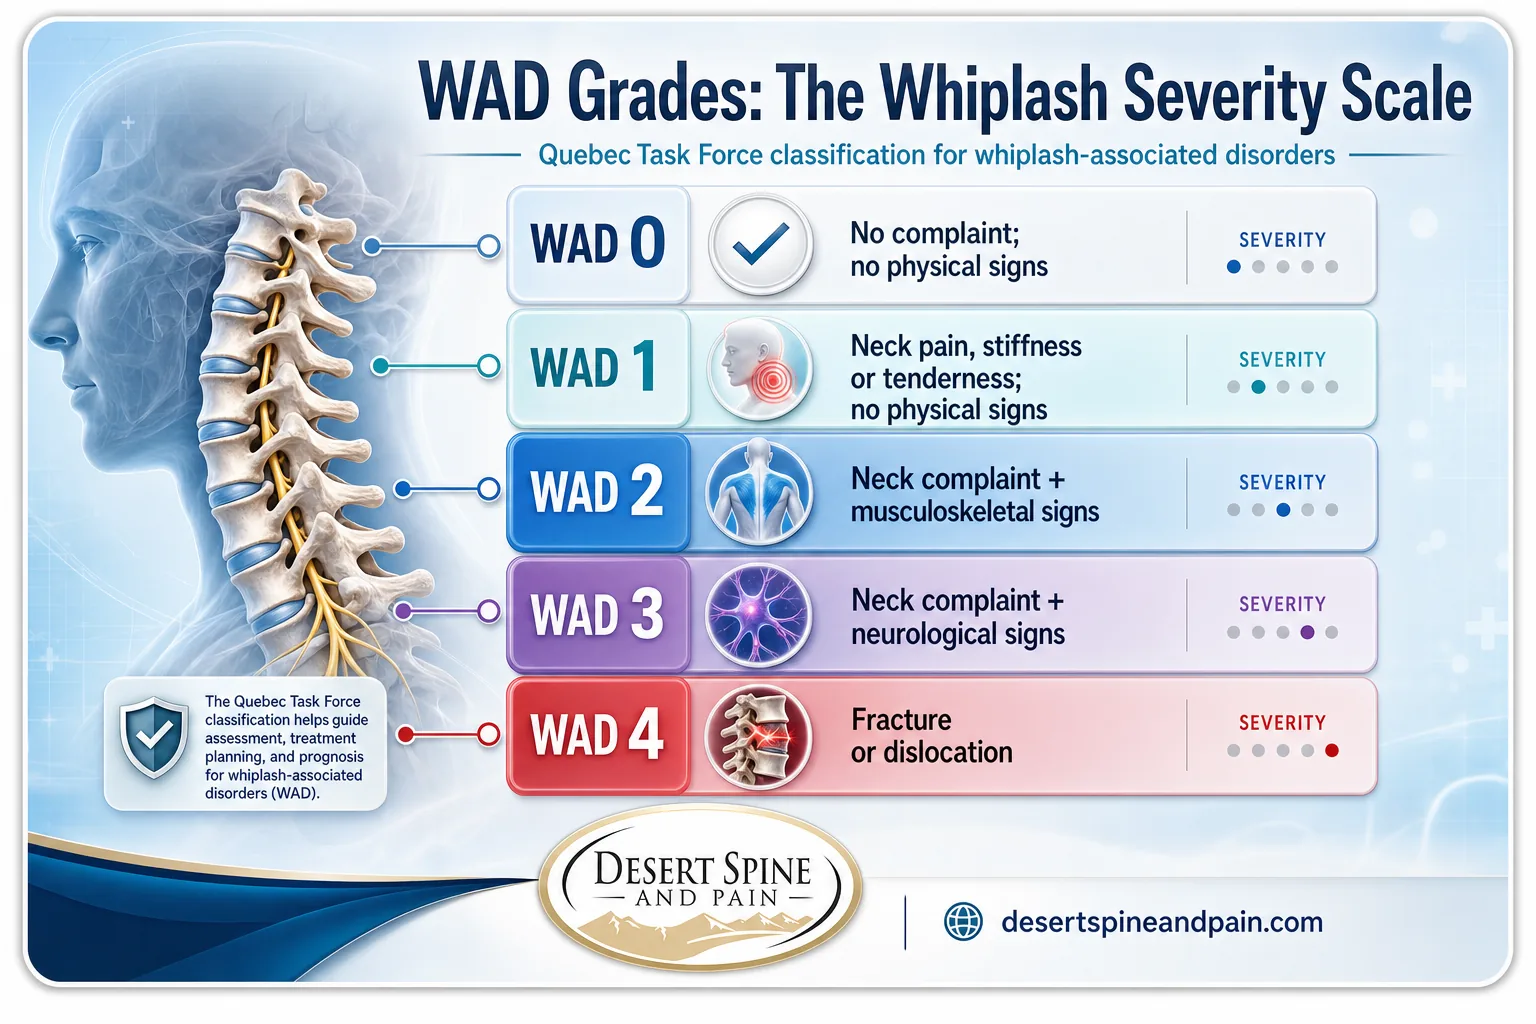
Source: National Institutes of Health, WAD Classification and Recovery
6 Treatment and When to See a Specialist
The treatment picture for whiplash has shifted in an important way: rest is no longer considered the best path to recovery. Current evidence favors early, active management, and that changes what patients should do after a crash.
For most whiplash, a least-invasive-first approach works well: early activity within comfort, targeted rehabilitation, and appropriate pain management, rather than a collar and prolonged rest. When pain persists or the WAD grade is higher, interventional options and specialist evaluation come into play. Because the three-month mark is such a strong predictor of long-term outcome, escalating care before recovery stalls is a sound strategy.
Certain symptoms warrant prompt specialist evaluation: neck pain that persists beyond a few weeks or worsens, radiating pain, numbness, tingling, weakness, or persistent headaches. These can signal nerve involvement or a higher-grade injury.
How Desert Spine and Pain fits in
Desert Spine and Pain is led by Dr. David L. Greenwald, a board-certified surgeon who is both a spine surgeon and a neurosurgeon. That expertise matters most for the higher-grade whiplash injuries that involve the nerves or structural damage, exactly the cases where an accurate diagnosis changes the outcome. The practice pursues the least invasive effective treatment first and reserves surgery for the minority of cases that need it. For personal injury attorneys, it offers 24/7 concierge coordination, fast response, and clear documentation for clients across the Phoenix area.
Book a consultation or connect our team with your attorney
Source: American Association of Neurological Surgeons
7 Summary Data Table
| Statistic | Figure | Source | Year |
|---|---|---|---|
| Annual whiplash injuries (U.S.) | ~2.3 million | Commonly cited (CDC-attributed) | Cited |
| Whiplash share of all crash injuries | ~25% | Commonly cited | Cited |
| Female vs male susceptibility | 2-3x higher | Clinical literature | Cited |
| Most affected age group | 30-50 | Clinical literature | Cited |
| Children's relative risk | ~2/3 of adults | Spine research data | Cited |
| Recover within 3-6 months | >50% | NIH peer-reviewed | 2019 |
| Transition to chronic pain/disability | ~25% | NIH peer-reviewed | 2019 |
| Fail to fully recover | up to 50% | NIH peer-reviewed | 2019 |
| Report permanent symptoms | ~10% | Clinical literature | 2026 |
| Chronic neck disability from MVC WAD | ~50% of injuries | NIH peer-reviewed | 2024 |
| Minimum speed change causing lasting whiplash | ~8 km/h (5 mph) | NIH (Krafft et al.) | Cited |
| WAD general-population prevalence (Denmark) | 2.9% | NIH cohort study | 2024 |
| WAD general-population prevalence (Japan) | 1.2% | NIH cohort study | 2024 |
| Key recovery checkpoint | 3 months | NIH peer-reviewed | 2019 |
| WAD classification range | Grade 0-4 | Quebec Task Force | Standard |
| Chronic whiplash transitions (derived) | ~500,000/year | Desert Spine and Pain analysis | 2026 |
Frequently Asked Questions
How common is whiplash?
How long does whiplash take to heal?
Can you get whiplash from a low-speed crash?
Why is my whiplash worse than my friend's from a bigger crash?
When should I see a specialist for whiplash?
All figures trace to their most authoritative available source. Recovery rates, chronic-transition data, the three-month checkpoint, low-speed injury thresholds, and general-population WAD prevalence are drawn from peer-reviewed research published through the National Institutes of Health. Prevalence figures of roughly 2.3 million annual injuries and the 25 percent share of crash injuries are widely cited and commonly attributed to the CDC; this report presents them as commonly cited figures rather than pinning them to a single primary release, and anchors the clinically important recovery data to the peer-reviewed studies. The WAD grading reflects the standard Quebec Task Force classification. Where Desert Spine and Pain derives a national chronic-transition estimate, that calculation is labeled as original interpretation.



