
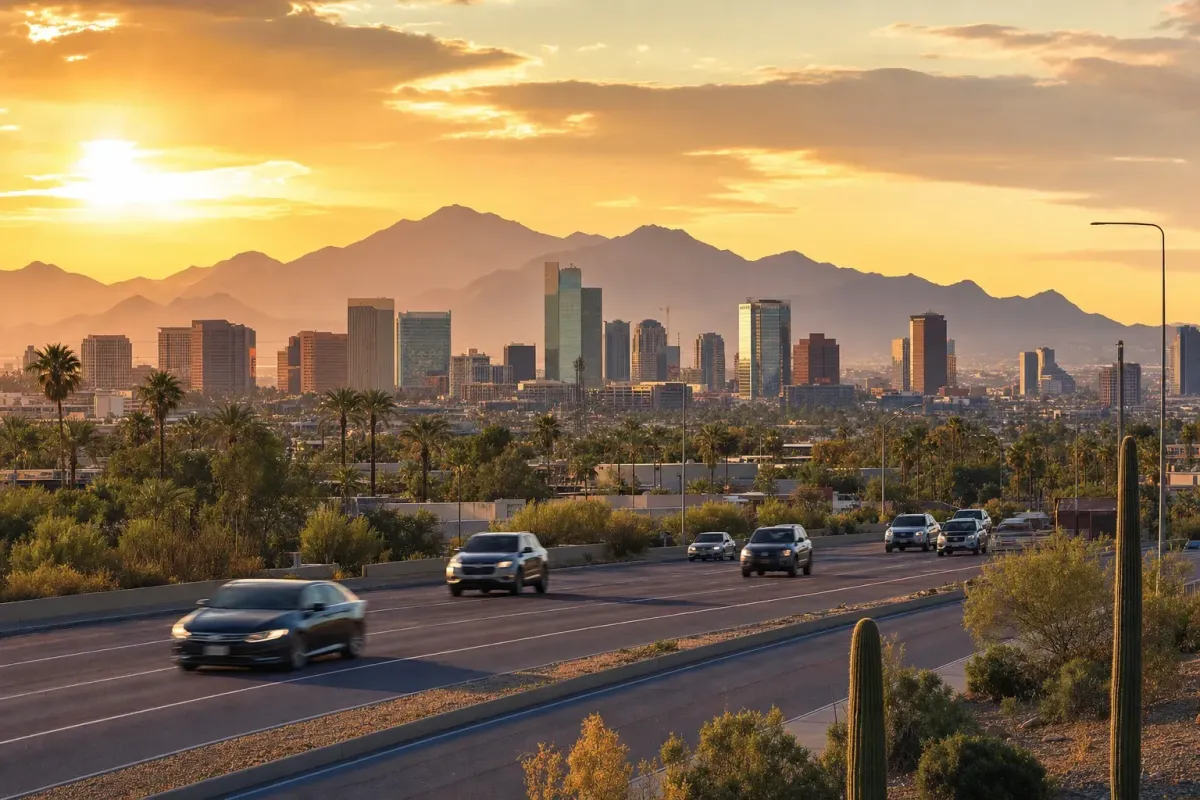
Phoenix Car Accident Statistics (2026): City Crash Data, Hotspots, and Trends
Phoenix recorded 37,472 crashes in 2024, more than 100 every day, the highest total of any city in Arizona according to the Arizona Department of Transportation. The city dominates the state's crash data in ways that reveal just how concentrated the risk is in one metro. This report breaks down the current Phoenix numbers, the corridors where crashes cluster, and what they mean for the people driving these roads.
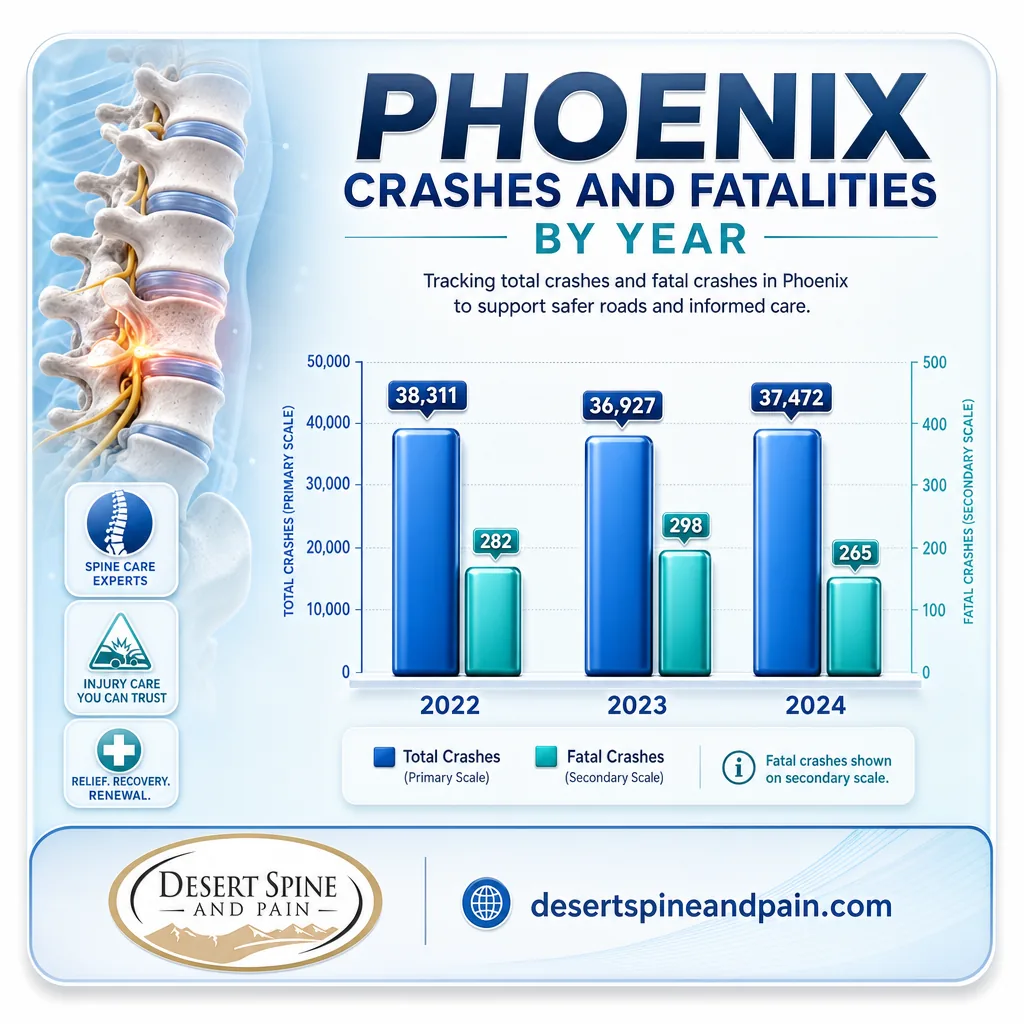
- Phoenix logged 37,472 crashes in 2024, up from 36,927 in 2023, averaging more than 100 per day, per ADOT.
- Fatal crashes in the city fell to 265 in 2024 from 298 in 2023, with people killed dropping from 307 to 278.
- Phoenix accounts for more than 40 percent of Maricopa County crashes, and the county makes up over 70 percent of the state total.
- The city's pedestrian toll is severe: 774 pedestrian crashes and about 100 deaths in 2023 alone.
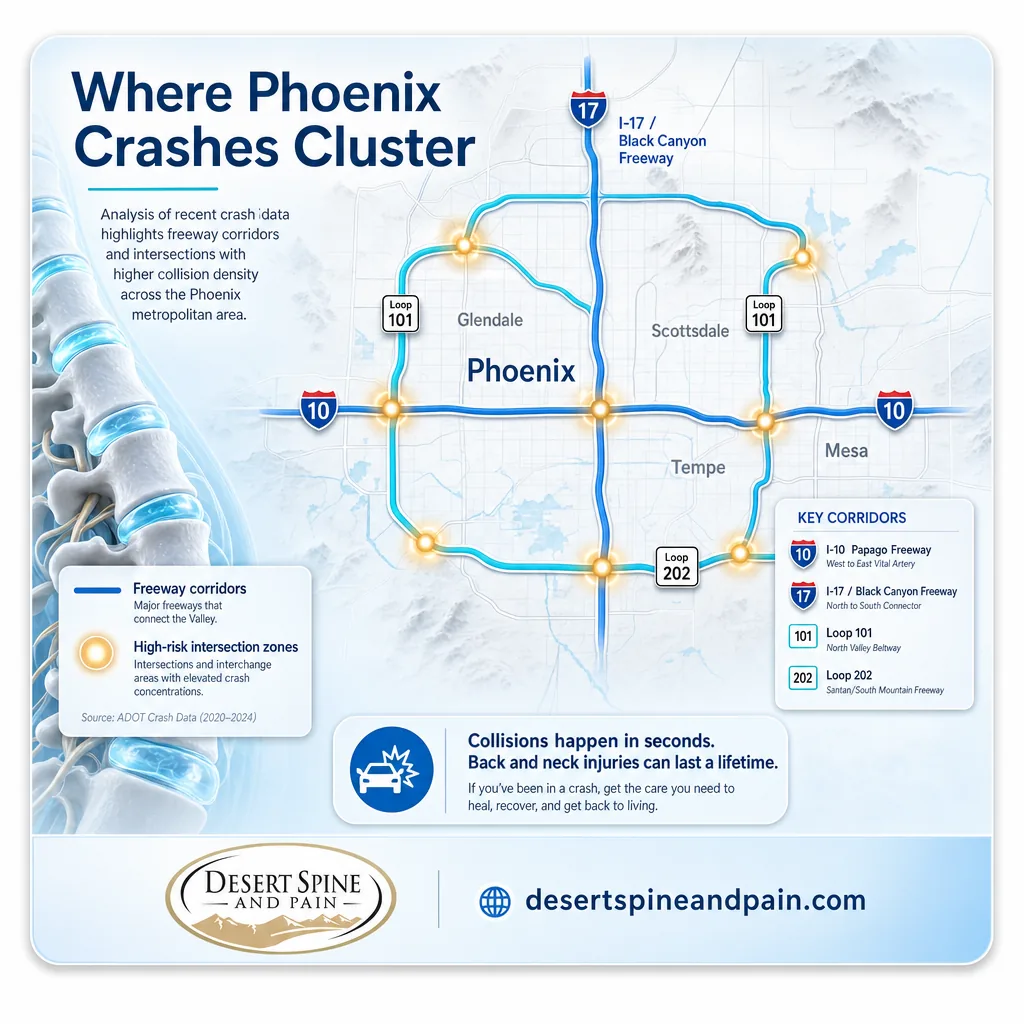
- Crashes concentrate on I-10, I-17, Loop 101, and Loop 202 and at busy signalized intersections.
- Phoenix's per-capita fatality rate runs higher than both the statewide and national averages.
What's in This Report
1 Phoenix Crash Totals and Trend
Phoenix is the fifth-largest city in the United States and the most populous in Arizona, and its crash numbers reflect that scale. The city consistently records more crashes than any other in the state, by a margin that is not close.
The recent trend is mixed. Total crashes rose slightly from 36,927 in 2023 to 37,472 in 2024, but fatal crashes moved in the right direction, dropping from 298 to 265, with the number of people killed falling from 307 to 278. The modest decline in fatalities is welcome, but the overall crash volume remains extraordinarily high for a single city.
For the statewide picture these city numbers sit inside, see our companion report on Arizona car accident statistics.
Source: Arizona Department of Transportation, Motor Vehicle Crash Facts
2 How Phoenix Dominates Arizona Crash Data
Arizona reports crash data by county rather than breaking out every city, but the concentration is unmistakable. Maricopa County, which contains Phoenix and its suburbs, accounted for more than 71 percent of the state's total crashes in a recent reporting year and over 54 percent of its fatal collisions. Within that county, Phoenix itself made up over 40 percent of the crashes.
The comparison with other cities makes the point starkly. In 2023, Phoenix recorded 307 traffic deaths. The next closest cities were not remotely close: Mesa recorded 54, Glendale 40, and Scottsdale 17. Phoenix's fatality count dwarfed the rest of the state.
2023 Traffic Deaths: Phoenix vs Other Valley Cities
Using population and crash-death figures from ADOT Crash Facts, Phoenix's traffic fatality rate has run around 18 deaths per 100,000 residents, compared with roughly 16 per 100,000 statewide and about 12 nationally in recent years. That places Phoenix meaningfully above both benchmarks, consistent with wide high-speed roads and heavy commuting volume.
Calculation and interpretation original to Desert Spine and Pain.
Source: Arizona Department of Transportation, Crash Facts
3 Where Crashes Happen: Corridors and Intersections
Phoenix crashes are not random. They cluster on the freeway corridors that carry the Valley's commuters and at the busy signalized intersections where traffic from multiple directions meets.
The interstate and state highway system carries the majority of serious crashes. I-10 through downtown, I-17 (the Black Canyon Freeway, including the "Stack" interchange), Loop 101, and Loop 202 all see high crash volumes, worsened during construction and rush hours. On surface streets, wide multi-lane arterials with high speed limits create long crossing distances and the conditions for severe intersection collisions.
- Freeway corridors: I-10, I-17, Loop 101, and Loop 202 carry the bulk of high-speed crashes.
- Signalized intersections: red-light running and failure to yield produce side-impact "T-bone" crashes with high injury risk.
- Wide arterials: multi-lane surface streets with high speed limits raise both crash frequency and severity.
- Monsoon corridors: dust storms and sudden rain trigger multi-vehicle pileups, especially on I-10.
Intersection crashes are among the most injurious crash types precisely because they are side-impacts. The vehicle door offers far less protection than the front or rear crumple zones, so the occupant's body, including the neck and spine, absorbs more of the force. A "T-bone" at moderate speed can cause significant spine and soft tissue injury even when the vehicles remain drivable.
Source: Maricopa Association of Governments, Regional Crash Trends | Arizona Department of Transportation, Crash Facts
4 Pedestrian and Cyclist Safety
Phoenix's road design prioritizes moving vehicles quickly, and that comes at a cost for people outside of cars. The city's pedestrian and cyclist crash figures are among the most troubling in its entire safety profile.
In 2023, Phoenix recorded 774 pedestrian crashes, which resulted in roughly 100 deaths and hundreds of injuries. Bicycle collisions that same year produced eight deaths and 257 injuries. Statewide, about 40 percent of pedestrian crashes were fatal, a figure that reflects both the severity of the impacts and the speed at which they occur on wide desert arterials.
Pedestrians and cyclists who survive a collision frequently sustain serious spine and orthopedic injuries, because the unprotected body absorbs the full force of the vehicle. These are exactly the high-energy mechanisms that produce fractures and disc injuries requiring specialist spine care.
Source: Arizona Department of Transportation, Crash Facts
See the spine conditions we treat after a crash
5 What's Driving Phoenix Crashes
The causes behind Phoenix crashes are consistent and, in most cases, preventable. Speeding leads the list, a factor in roughly a third of traffic fatalities statewide, and Phoenix's wide fast roads make it especially lethal here. Failure to yield, cited in nearly a third of city crashes where a traffic violation was listed, drives many of the intersection collisions. Alcohol impairment is heavily concentrated in the city: Phoenix accounts for roughly 38 percent of all alcohol-related crashes statewide and nearly half of alcohol-related traffic deaths.
Distracted driving remains a persistent factor despite Arizona's hands-free law, and aggressive driving behaviors, including tailgating and unsafe lane changes, contribute heavily on the multi-lane freeways. One structural factor compounds the problem: Phoenix traffic enforcement has thinned significantly, with the number of officers dedicated to traffic enforcement falling sharply in recent years.
Leading Crash Factors Affecting Phoenix
Source: Arizona Department of Transportation, Motor Vehicle Crash Facts
6 The Injury Aftermath and What to Do
For anyone actually involved in one of these crashes, the statistics matter less than what happens next. Two points from the data are worth carrying forward.
First, injuries do not always match the impact. Neck and back injuries, including whiplash and disc injuries, often produce symptoms that are delayed, worsening over days to weeks as inflammation builds. Someone who feels only stiff at the scene of an intersection crash can develop significant pain later, which is why early medical evaluation is valuable both clinically and for documentation. Second, timing matters legally. Arizona generally sets a two-year deadline from the date a claim accrues to file a personal injury lawsuit, though shorter windows can apply in some situations.
A Phoenix spine specialist built for this
Desert Spine and Pain is a Phoenix practice built to serve exactly the injuries these roads produce. It is led by Dr. David L. Greenwald, a board-certified surgeon who is both a spine surgeon and a neurosurgeon, dual training that matters when a case turns on precisely what was injured and why. The practice pursues the least invasive effective treatment first, escalating to surgery only when the condition calls for it. For personal injury attorneys, the practice offers 24/7 concierge coordination, fast response, and clear documentation for their clients across the Valley, from Phoenix and Scottsdale to Mesa, Tempe, Chandler, and Glendale.
Book a consultation or connect our team with your attorney
Source: Arizona State Legislature, ARS 12-542 (statute of limitations)
7 Summary Data Table
| Statistic | Figure | Source | Year |
|---|---|---|---|
| Phoenix total crashes | 37,472 | ADOT Crash Facts | 2024 |
| Phoenix total crashes (prior year) | 36,927 | ADOT Crash Facts | 2023 |
| Phoenix total crashes | 38,311 | ADOT Crash Facts | 2022 |
| Phoenix fatal crashes | 265 | ADOT Crash Facts | 2024 |
| Phoenix fatal crashes (prior year) | 298 | ADOT Crash Facts | 2023 |
| People killed in Phoenix crashes | 278 | ADOT Crash Facts | 2024 |
| People killed in Phoenix crashes (prior year) | 307 | ADOT Crash Facts | 2023 |
| Crashes per day in Phoenix | 100+ | ADOT Crash Facts | 2024 |
| Maricopa County share of state crashes | ~71% | ADOT Crash Facts | 2023 |
| Maricopa County share of state fatal crashes | ~54% | ADOT Crash Facts | 2023 |
| Phoenix share of county crashes | 40%+ | ADOT Crash Facts | 2023 |
| Phoenix pedestrian crashes | 774 | ADOT Crash Facts | 2023 |
| Phoenix pedestrian deaths | ~100 | ADOT Crash Facts | 2023 |
| Phoenix cyclist crashes | 265 (8 deaths) | ADOT Crash Facts | 2023 |
| Phoenix share of statewide alcohol crashes | ~38% | ADOT Crash Facts | 2023 |
| Mesa / Glendale / Scottsdale deaths | 54 / 40 / 17 | ADOT Crash Facts | 2023 |
| Phoenix fatality rate per 100k (derived) | ~18 | Desert Spine and Pain analysis | 2023 |
Frequently Asked Questions
How many car accidents happen in Phoenix each year?
Is Phoenix dangerous for drivers compared to the rest of Arizona?
Where do most car accidents happen in Phoenix?
How dangerous is Phoenix for pedestrians?
I have neck or back pain after a Phoenix crash. What should I do?
All figures trace to primary sources. Phoenix and Maricopa County crash totals, fatalities, pedestrian and cyclist data, alcohol involvement, and causation factors are drawn from the Arizona Department of Transportation's Motor Vehicle Crash Facts and Phoenix-area figures reported within that data, across the 2022 through 2024 reporting years. Regional corridor and intersection risk patterns reference Maricopa Association of Governments crash-trend data. Where Desert Spine and Pain derives a per-capita rate from published crash and population figures, that calculation is labeled and identified as original interpretation. Specific per-intersection crash counts circulated by some sources vary and are not published uniformly by ADOT, so this report describes corridor and intersection risk patterns rather than ranking individual intersections by unverified counts.



