
Arizona Car Accident Statistics (2026): Crashes, Causes, and Trends Across the State
Arizona logged 121,107 motor vehicle crashes in 2024, roughly 330 every day, according to the Arizona Department of Transportation. Behind that headline number sit clear patterns in what causes crashes, when they happen, and where they concentrate. This overview lays out the current statewide data and what it means for the people living and driving across Arizona.
Key Takeaways
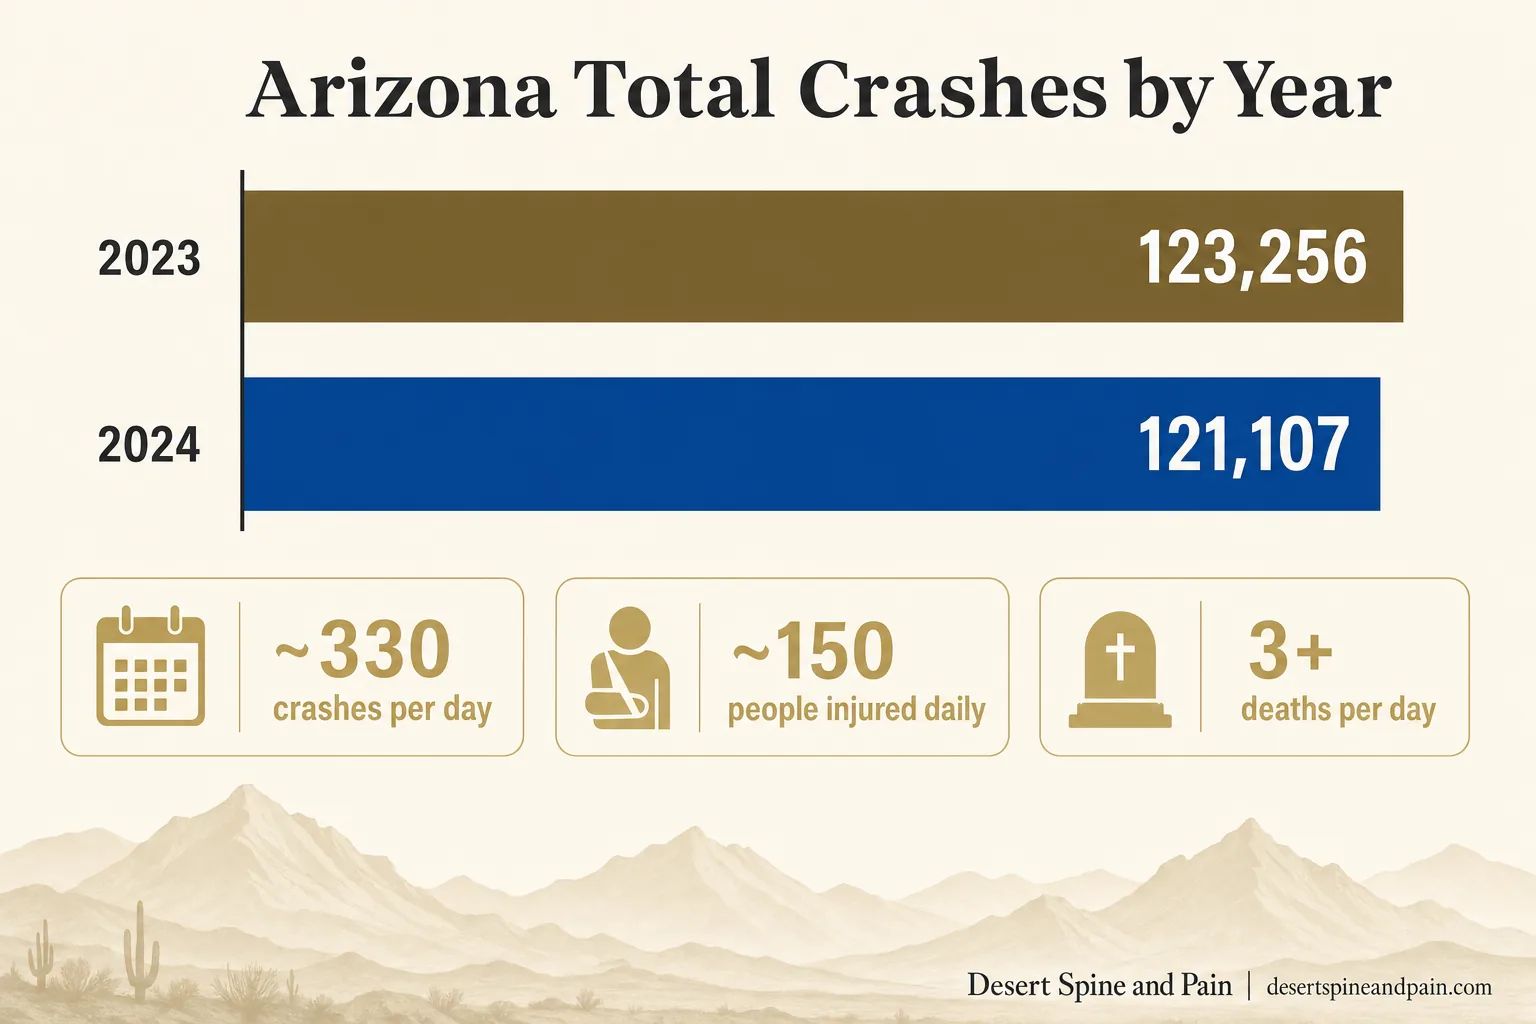
Arizona recorded 121,107 crashes in 2024, down about 1.7 percent from 123,256 in 2023, per ADOT Motor Vehicle Crash Facts.
Speeding factors into roughly a third of traffic fatalities, making it one of the state's most persistent crash causes.
Traffic deaths fell to 1,228 in 2024, a 6.1 percent decline, with national early estimates pointing to a further drop in 2025.
Maricopa County and Phoenix lead the state in crashes, with Phoenix accounting for close to a third of the statewide total.
More traffic deaths occur on local roads than on state highways, a pattern that holds year to year.
Motorcyclists, pedestrians, and cyclists remain overrepresented in fatal crashes relative to their share of road users.
What's in This Report
1 Arizona Crash Totals and Trend
Arizona's crash volume has held remarkably steady across recent years, hovering above 120,000 collisions annually. The 2024 figure represents a modest improvement over 2023, but the scale remains enormous for a single state.
121,107
Total Arizona crashes, 2024
~330
Crashes per day, statewide
-1.7%
Change in total crashes from 2023 to 2024
The year-over-year trend tells a story of slow improvement. Arizona recorded 123,256 crashes in 2023 and 121,107 in 2024. The decline is real but modest, and the absolute numbers make clear that crashes remain a daily feature of life on Arizona roads.
Arizona Total Crashes by Year
2023
123,256
2024
121,107
For a closer look at the injury side of these numbers, including which injuries are most common and how the spine is affected, see our companion report on Arizona car accident injury stats.
Source: Arizona Department of Transportation, 2024 Motor Vehicle Crash Facts
2 Leading Causes of Arizona Crashes
Crash reports consistently point to a short list of human factors behind most collisions. These causes matter because they are, in large part, preventable, and because they shape the severity of the injuries that follow.
Speeding sits at or near the top. In recent ADOT reporting, speed was involved in roughly 34 percent of all traffic fatalities, making it the single most lethal driver behavior on Arizona roads. Lane departure crashes, often tied to distraction or impairment, accounted for hundreds of deaths in a single year. Alcohol-impaired driving was involved in more than a quarter of fatal crashes, and Arizona has seen alcohol-related fatalities rise across several consecutive years. Distracted driving rounds out the list, with thousands of drivers involved in collisions while distracted.
Leading Factors in Arizona Fatal Crashes (recent ADOT reporting)
Speed-involved fatalities
~34.1%
Alcohol-involved fatal crashes
~25.7%
Lane departure deaths (count)
823 deaths
Distracted drivers in crashes (count)
8,657 drivers
Myth: "Rear-end fender benders are too minor to cause real injury."
Low-speed rear-end collisions are one of the most common crash types, and they are a leading mechanism for whiplash and neck injuries. The body can be injured even when the vehicle shows little damage, because the forces transmitted to the neck and spine do not scale neatly with the dent in the bumper. Dismissing a low-speed crash as harmless is one of the more common and costly mistakes people make.
Source: Arizona Department of Transportation, Motor Vehicle Crash Facts
3 Fatal Crash Trends
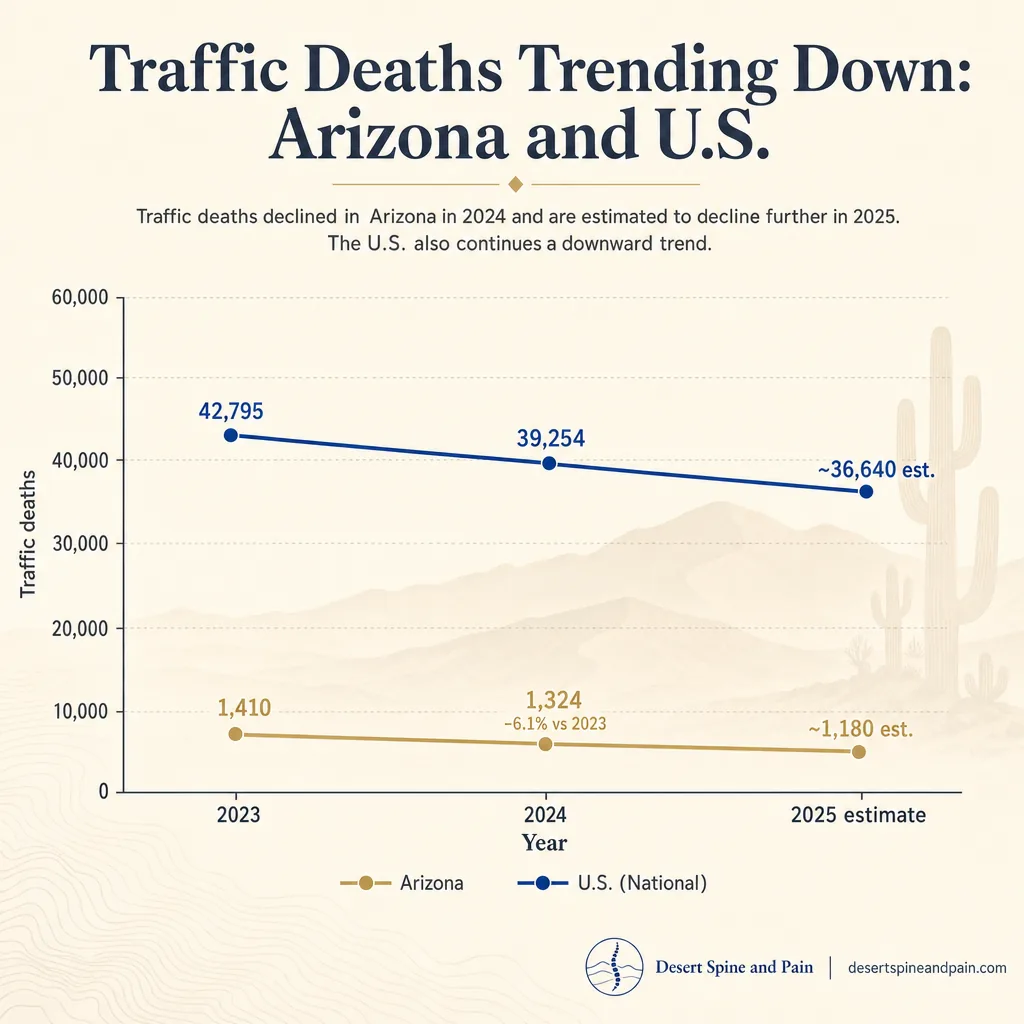
Fatalities are the clearest measure of how dangerous a given year was, and here Arizona has seen genuine, if fragile, progress. The state recorded 1,228 traffic deaths in 2024, down 6.1 percent from the prior year. That still averages to more than three deaths every day.
1,228
Arizona traffic deaths, 2024
-6.1%
Change in traffic deaths from 2023
National data provides context for the trend. The National Highway Traffic Safety Administration's early estimates for 2025 pointed to roughly 36,640 traffic deaths nationwide, a decline of about 6.7 percent from the 39,254 deaths recorded in 2024. The downward direction is encouraging, but Arizona has historically ranked among the states with higher per-capita fatality rates, driven by high mileage, wide fast corridors, and year-round driving conditions.
Desert Spine and Pain Analysis: Crashes per Fatality, Arizona 2024
Dividing Arizona's 121,107 total crashes by its 1,228 traffic deaths yields roughly one death for every 99 crashes. Put differently, about 1 percent of Arizona crashes are fatal, which underscores a point often lost in the headlines: the overwhelming majority of crashes are survivable, and the larger story is the far greater number of people who are injured and must recover.
Calculation and interpretation original to Desert Spine and Pain.
Source: Arizona Department of Transportation, 2024 Motor Vehicle Crash Facts | Insurance Institute for Highway Safety, Fatality Facts 2024
4 Where and When Crashes Happen
Arizona's crashes are heavily concentrated in the Greater Phoenix metro. Maricopa County leads the state, and Phoenix alone accounts for close to a third of all statewide collisions. That concentration follows the population and traffic volume, and it means the roads of the Valley generate the lion's share of the state's crash injuries.
~1/3
Phoenix share of statewide crashes
The pattern of where crashes turn deadly is counterintuitive. More traffic deaths occur on local roads than on the state highway system, and urban areas see nearly twice as many fatalities as rural ones. Timing matters too. Urban crashes cluster during weekday daytime hours and drop on weekends, while fatal crashes skew toward Fridays and Saturdays. Monsoon season adds its own spike, as sudden desert storms catch drivers unprepared for wet pavement.
When Arizona crashes peak
Weekday rush hours: the highest overall crash frequency, tied to commute volume.
Friday and Saturday: fatal crashes rise, often linked to impairment.
Monsoon season: crash rates jump during active storms as drivers adjust poorly to rain.
Local roads: more fatalities than on highways, despite lower speeds.
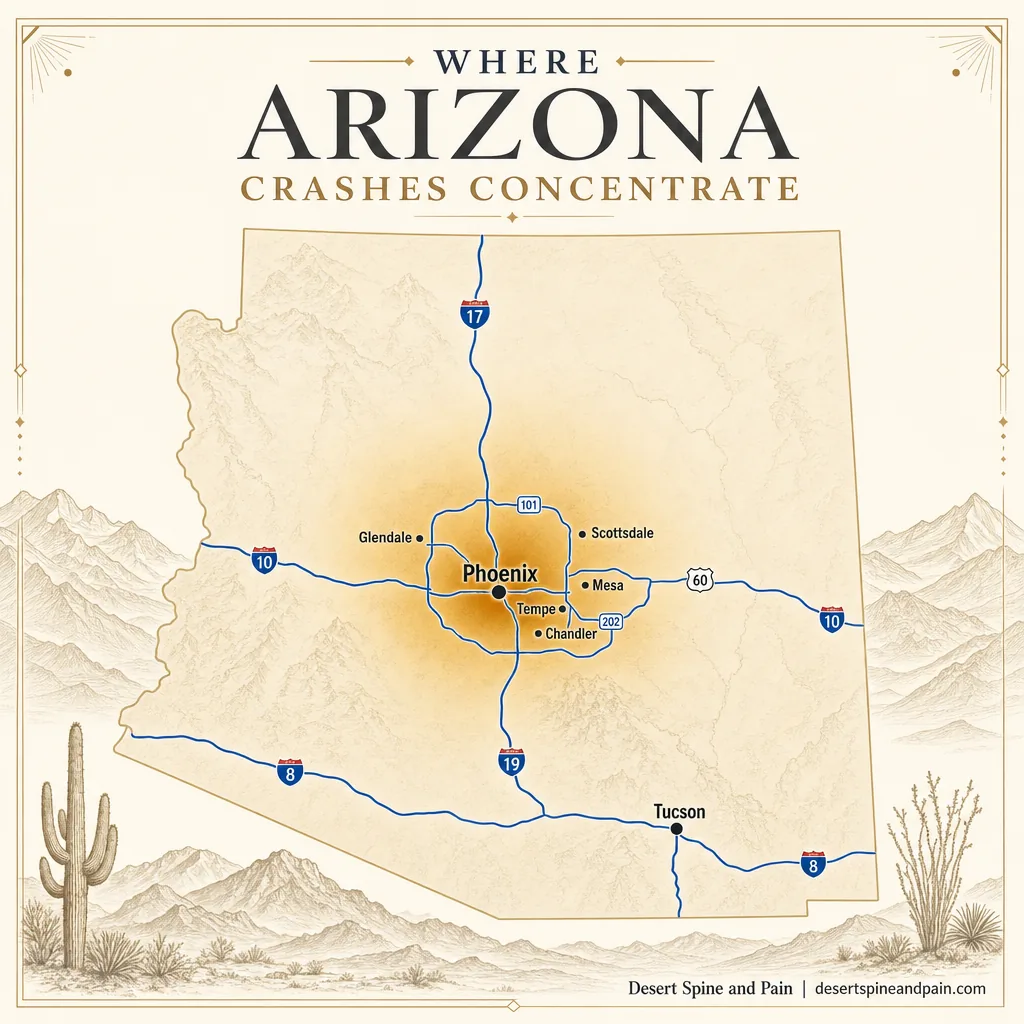
The Valley communities Desert Spine and Pain serves, from Phoenix and Scottsdale to Mesa, Chandler, Tempe, and Glendale, sit squarely in this high-volume zone. That local concentration is one reason access to a Phoenix-based spine surgeon matters for people hurt on these roads.
Source: Maricopa Association of Governments, Regional Crash Trends | Arizona Department of Transportation, Crash Facts
5 Vulnerable Road Users
Not everyone on the road faces the same risk. Motorcyclists, pedestrians, and cyclists are dramatically overrepresented in fatal crashes relative to how many of them are on the road, because they lack the protective structure a car provides.
Motorcyclist deaths in Arizona reached their highest level in at least two decades in a recent reporting year, totaling 258, an increase of more than 11 percent. Pedestrian and cyclist crashes carry a far higher fatality rate than typical vehicle collisions, a reflection of the basic physics of an unprotected person meeting a vehicle. These road users also frequently sustain serious spine and orthopedic injuries when they survive, because the body absorbs the full force of the impact.
Vulnerable Road User Fatality Notes (recent ADOT reporting)
Motorcyclist deaths (20-year high)
258
Pedestrian crash fatality share
~40% of ped crashes
Bicycle crash fatality share
elevated vs vehicle crashes
Source: Arizona Department of Transportation, Motor Vehicle Crash Facts
See the spine conditions we treat after a crash
6 The Injury Aftermath and What to Do
Statistics describe the scale of the problem. For anyone actually involved in a crash, the practical question is what happens next, and how to protect both your health and your rights.
The most important thing the data reinforces is that injuries and impact severity do not always match. Neck and back injuries, including whiplash and disc injuries, frequently produce symptoms that are delayed, worsening over days to weeks. Someone who feels only shaken at the scene can develop significant pain later. That reality makes early medical evaluation valuable, both to catch problems that are not yet obvious and to create an accurate record of what happened.
Arizona sets a general two-year deadline from the date a claim accrues to file a personal injury lawsuit, though shorter windows can apply in specific situations. Because a missed deadline can end a claim regardless of its merits, timing matters for anyone considering one.
This is general information, not legal or individual medical advice. Every crash and every injury is different. Anyone hurt in a collision should consult a qualified physician about their care and, where a claim is involved, a licensed attorney about their rights and deadlines.
How a spine specialist fits in
For injured patients and the personal injury attorneys who represent them, a spine practice offers accurate diagnosis, clear documentation, and a surgeon who understands how medical and legal timelines interact. Desert Spine and Pain is led by Dr. David L. Greenwald, a board-certified surgeon who is both a spine surgeon and a neurosurgeon, a dual training that matters when a case turns on exactly what was injured. The practice pursues the least invasive effective treatment first, moving to surgery only when the condition warrants it, and offers attorneys 24/7 concierge coordination for their clients across the Phoenix area.
Book a consultation or connect our team with your attorney
Source: Arizona State Legislature, ARS 12-542 (statute of limitations)
7 Summary Data Table
StatisticFigureSourceYear Total Arizona crashes121,107ADOT Crash Facts2024 Total Arizona crashes (prior year)123,256ADOT Crash Facts2023 Year-over-year change in crashes-1.7%ADOT Crash Facts2023-2024 Crashes per day~330ADOT Crash Facts2024 Traffic deaths1,228ADOT Crash Facts2024 Year-over-year change in deaths-6.1%ADOT Crash Facts2023-2024 Speed-involved share of fatalities~34.1%ADOT Crash Facts2023 Alcohol-involved share of fatal crashes~25.7%ADOT Crash Facts2023 Lane departure deaths823ADOT Crash Facts2023 Distracted drivers in crashes8,657ADOT Crash Facts2023 Motorcyclist deaths (20-year high)258ADOT Crash Facts2023 Fatalities on local roads828ADOT Crash Facts2023 Fatalities on state highways479ADOT Crash Facts2023 Phoenix share of statewide crashes~1/3ADOT Crash Facts2023-2024 U.S. traffic deaths (early estimate)~36,640NHTSA2025 U.S. traffic deaths39,254IIHS / FARS2024 Arizona crashes per fatality (derived)~99 to 1Desert Spine and Pain analysis2024
Frequently Asked Questions
How many car accidents happen in Arizona each year?
Arizona recorded 121,107 motor vehicle crashes in 2024, the most recent full year reported by the Arizona Department of Transportation. That works out to roughly 330 crashes per day. The 2024 total was down about 1.7 percent from the 123,256 crashes recorded in 2023.
What is the leading cause of car accidents in Arizona?
Speeding is consistently among the top contributors to fatal crashes in Arizona, involved in roughly a third of traffic fatalities. Other major factors include lane departure, alcohol-impaired driving, and distracted driving, which involved thousands of drivers in recent reporting years.
Is car accident fatality going up or down in Arizona?
Arizona traffic deaths declined in 2024 to 1,228, down about 6.1 percent from 2023. National early estimates from NHTSA suggest a further decline in 2025. Even with the recent drop, Arizona's per-capita fatality rate remains higher than the national average.
Where do most car accidents happen in Arizona?
Crashes concentrate in the Greater Phoenix metro and Maricopa County, which lead the state by a wide margin. Phoenix alone accounts for close to a third of statewide crashes. Most crashes occur in urban settings, though fatal crashes are more common on local roads than on state highways.
What should I do about neck or back pain after a car accident?
Neck and back injuries are among the most common outcomes of a crash, and symptoms can be delayed. A specialist evaluation documents the injury and identifies problems early. At Desert Spine and Pain in Phoenix, board-certified spine surgeon and neurosurgeon Dr. David L. Greenwald evaluates crash-related spine injuries and pursues the least invasive effective treatment first.
Methodology and Sources
All figures trace to primary sources. Arizona crash totals, fatalities, causation factors, geographic distribution, and vulnerable-road-user data are drawn from the Arizona Department of Transportation's Motor Vehicle Crash Facts, the state's official annual crash report, across the 2023 and 2024 reporting years. National fatality figures come from the Insurance Institute for Highway Safety, based on the U.S. Department of Transportation's Fatality Analysis Reporting System, and from NHTSA early fatality estimates for 2025. Where Desert Spine and Pain combines figures to produce a derived ratio, that calculation is labeled and identified as original interpretation. Some causation percentages reflect the most recent year for which ADOT has published a full breakdown and are noted by year in the summary table.
Media and press use: Journalists and researchers are welcome to cite these statistics with attribution to Desert Spine and Pain and a link to this page. For questions about the data or to arrange comment from Dr. David L. Greenwald, contact the practice directly.