

Low Back Pain Statistics (2026): Prevalence, Causes, and Outlook
Low back pain is pain between the lower ribs and the buttocks, and it is one of the most common conditions on earth: about 619 million people had it in 2020. The reassuring part is that roughly 90% of it is nonspecific mechanical pain that improves with the right care. Here is the 2026 data, from primary sources only.
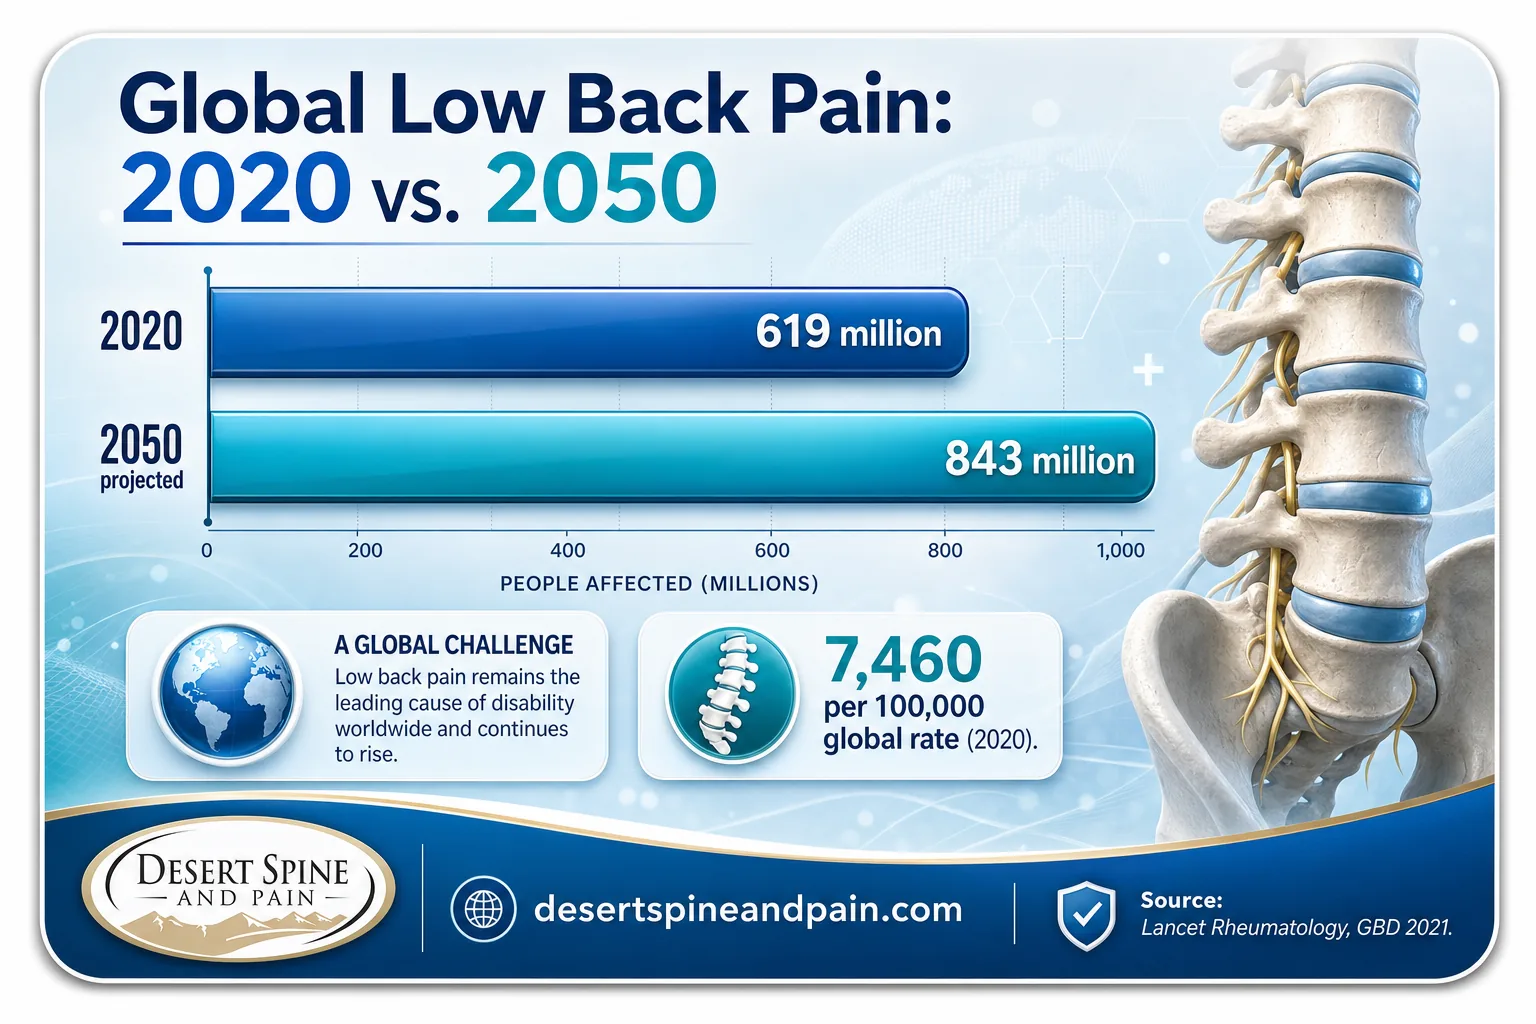
- 619 million people worldwide had low back pain in 2020, rising to a projected 843 million by 2050 (Lancet Rheumatology).
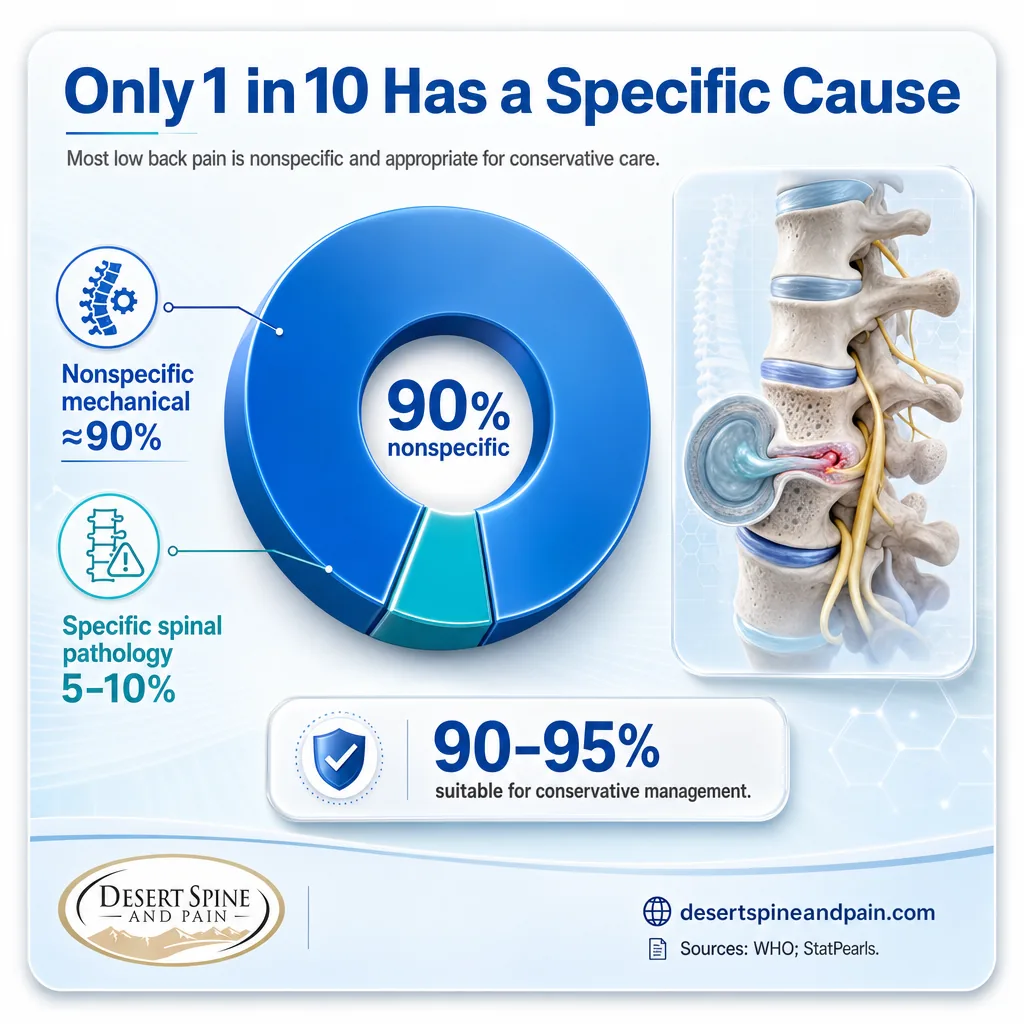
- About 90% of low back pain is nonspecific mechanical pain with no single structural cause (WHO).
- Only 5% to 10% of low back pain stems from a specific diagnosable spinal condition (StatPearls).
- Disc degeneration appears in 80%+ of adults over 50, including many with no pain at all (StatPearls).
- The global point-prevalence rate was about 7,460 per 100,000 people in 2020 (Lancet Rheumatology).
- Around 28% of U.S. adults reported chronic low back or sciatic pain in 2022.
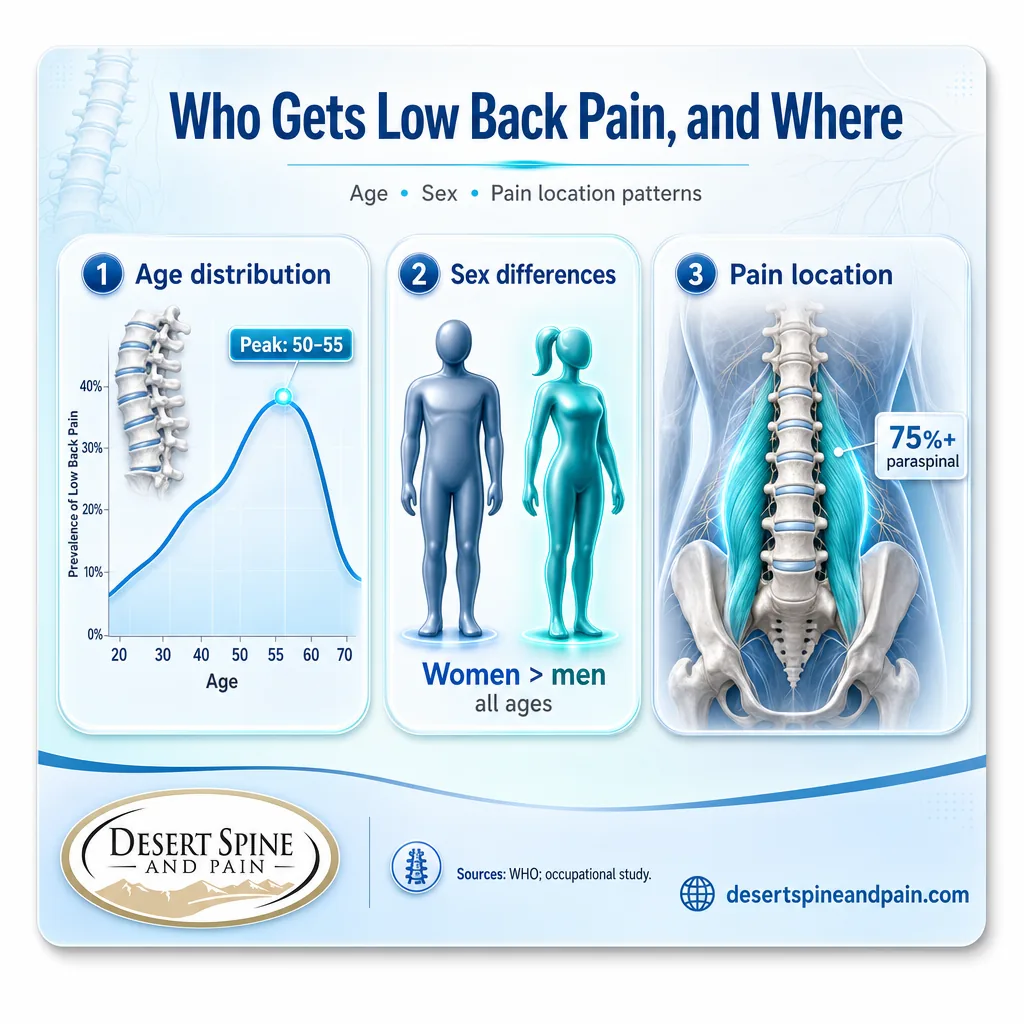
- Low back pain is more prevalent in women than men in every age group.
What's in This Guide
1 What Low Back Pain Is and How Common
Global Burden of Disease researchers use a precise definition: low back pain is pain in the area from the lower margin of the twelfth ribs to the lower gluteal folds, with or without pain referred into one or both legs, lasting at least one day. That definition matters, because it is what makes the worldwide numbers comparable across 204 countries.
Low back pain is the most common presentation of back pain overall, and it is the single condition responsible for more years lived with disability than any other worldwide. For a broader view of all back pain, including neck and mid-back, see our full roundup of back pain statistics. This article focuses specifically on the lumbar region.
If lower back pain is affecting your daily life, the cause can usually be identified through a proper evaluation. Understanding which type of low back pain you have is the first step toward the least-invasive effective treatment.
Explore the spine conditions we treatSource: World Health Organization | The Lancet Rheumatology (GBD 2021)
2 The 90% Rule: Nonspecific vs. Specific
The most important statistic in all of low back pain research is also the most reassuring. The overwhelming majority of low back pain has no single, identifiable structural cause that imaging can point to. Clinicians call this nonspecific mechanical pain, and it is the norm, not the exception.
StatPearls puts the figures precisely: fewer than 5% to 10% of low back pain presentations result from specific spinal pathology, while 90% to 95% reflect nonspecific mechanical pain suitable for conservative management. This is exactly why a least-invasive-first philosophy is the clinical standard. Most people do not need surgery, and many do not even need advanced imaging at first.
Myth: "Severe low back pain means I need surgery."
The data say otherwise. Because 90% or more of low back pain is nonspecific and most acute episodes improve, surgery is the right answer only for the minority of cases with a specific, surgically treatable cause such as significant nerve compression that has not responded to conservative care. The value of a surgeon who is also a neurosurgeon is knowing exactly which cases fall into that minority, so no one is pushed toward an operation they do not need, or away from one they do.
Source: World Health Organization | StatPearls (NCBI Bookshelf)
See conservative, non-invasive care options3 What Imaging Actually Shows
One of the biggest sources of confusion in low back pain is imaging. Scans frequently show changes that sound alarming but are, in fact, a normal part of aging and often present in people with no pain whatsoever.
StatPearls is direct about this: disc degeneration, disc bulging, and facet arthropathy are highly prevalent in asymptomatic adults, and disc degeneration occurs in more than 80% of adults older than 50. Early imaging in adults has been associated with poorer outcomes, because it often leads to more invasive interventions that provide minimal benefit. The clinical takeaway is that imaging findings must be interpreted within the context of a patient's actual symptoms, never in isolation.
Why this matters for your care
A scan that shows a "degenerated disc" or a "bulge" does not automatically explain your pain, and it certainly does not automatically mean surgery. A thorough evaluation matches what the imaging shows to what you actually feel and how you function. Dr. David L. Greenwald, MD, FACS, a board-certified spine surgeon and neurosurgeon, evaluates both together before recommending any treatment.
Source: StatPearls (NCBI Bookshelf)
Learn about diagnostic nerve testing4 Age, Sex, and Location Patterns
Low back pain follows consistent demographic patterns. It rises with age, affects women more than men, and concentrates in a specific part of the lower back.
A systematic review of chronic low back pain found prevalence rises roughly linearly from the third decade of life until about age 60, and is consistently higher in women. Prevalence increases with age up to about 80 years, but because of population size, the largest number of people living with low back pain at any moment are those aged 50 to 55. When researchers mapped exactly where in the low back people hurt, over 75% reported pain in the immediate paraspinal area, the muscular region just beside the spine.
Chronic Low Back Pain Prevalence Rises With Age (systematic review ranges)
Source: Systematic review, chronic low back pain prevalence | World Health Organization
Explore interventional pain management5 Chronic Low Back Pain in the U.S.
When low back pain persists beyond three months, it becomes chronic, and that is where most of the disability and cost concentrate. Chronic low back pain has become notably more common in the U.S. over recent decades.
The trend line is clear: chronic low back pain prevalence rose from under 5% in the early 1990s to over 10% by the mid-2000s in tracking studies, and 2022 survey data put chronic low back or sciatic pain at roughly 28% of U.S. adults. Just as telling, about 84% of people with chronic low back pain said they wished there were better treatment options, a sign that many are not getting relief from standard approaches alone.
Desert Spine and Pain Analysis: The Treatment-Gap Signal
Two Tier 1 data points, read together, describe a real gap. Statista survey data show 84% of chronic low back pain patients wished for better treatment options, while StatPearls confirms that 90% to 95% of cases are suitable for conservative management. The implication: a large share of dissatisfied patients may never have been matched to the right conservative or interventional treatment before their pain became entrenched. A full-spectrum practice that spans conservative care, interventional pain procedures, and surgery is positioned to close exactly that gap.
Formula: Statista treatment-dissatisfaction (84%) viewed against StatPearls conservative-suitability (90–95%). Calculation and interpretation original to Desert Spine and Pain. Sources: Statista; StatPearls.
Source: Statista, back pain in the U.S. | StatPearls (NCBI Bookshelf)
Learn about epidural steroid injections6 The 2050 Outlook
The forecast for low back pain is one of steady growth in total cases, driven by demographics rather than a rising individual risk.
Projected Low Back Pain Cases, High-Income North America and Global
Statista projections based on the Lancet data note that the overall prevalence rate will not change dramatically, with just over 7% of the global population expected to have low back pain in 2050. In high-income North America specifically, about 57 million people are projected to be affected by 2050. The message is not that low back pain is becoming individually more dangerous, but that more people, and more older people, means a larger absolute burden that health systems and specialists must be ready to meet.
Source: Statista / Lancet Rheumatology forecast | The Lancet Rheumatology (GBD 2021)
Meet Dr. Greenwald: spine surgeon and neurosurgeon7 Every Statistic in One Table
| Statistic | Figure | Source | Year |
|---|---|---|---|
| Global low back pain cases | 619 million | Lancet Rheumatology (GBD 2021) | 2020 |
| Projected global cases by 2050 | 843 million | Lancet Rheumatology (GBD 2021) | 2050 |
| Global point-prevalence rate | 7,460 per 100,000 | Lancet Rheumatology / Statista | 2020 |
| Lifetime prevalence of low back pain | Up to 84% | UpToDate | 2026 |
| Nonspecific mechanical share | ~90% | WHO | 2023 |
| Specific spinal pathology share | 5–10% | StatPearls | 2025 |
| Suitable for conservative management | 90–95% | StatPearls | 2025 |
| Adults over 50 with disc degeneration | 80%+ | StatPearls | 2025 |
| U.S. adults with chronic low back/sciatic pain | ~28% | Statista survey | 2022 |
| U.S. chronic LBP prevalence at any time | 5–10% | NIH background | 2016 |
| Chronic LBP patients wanting better options | 84% | Statista survey | 2022 |
| Highest global case count age band | 50–55 | WHO | 2023 |
| Sex pattern | Women > men, all ages | WHO | 2023 |
| Chronic LBP prevalence, age 20–59 | 19.6% | Systematic review | 2015 |
| Chronic LBP prevalence, age 24–39 | 4.2% | Systematic review | 2015 |
| Pain in immediate paraspinal area | 75%+ | Occupational prevalence study | 2014 |
| Projected N. America cases by 2050 | 57 million | Statista / Lancet | 2050 |
| Global population share with LBP by 2050 | ~7% | Statista / Lancet | 2050 |
Frequently Asked Questions
What is low back pain and how common is it?
What percentage of low back pain has a specific cause?
How many U.S. adults have chronic low back pain?
Does an MRI finding always explain low back pain?
Is low back pain getting more common?
Methodology and Sources
Every statistic in this article is drawn from a Tier 1 primary source: a government agency, a peer-reviewed study, or a major research institution. No blog-to-blog citations are used. Where estimates vary by methodology, ranges are shown rather than a single figure.
Primary sources:
- World Health Organization: low back pain fact sheet, including the nonspecific share and demographic patterns.
- The Lancet Rheumatology: Global Burden of Disease Study 2021, global prevalence and projections to 2050 (Ferreira et al.).
- StatPearls (NCBI Bookshelf): low back pain evaluation and management, imaging findings, and specific-versus-nonspecific breakdown.
- UpToDate: evaluation of low back pain in adults, lifetime prevalence.
- Statista: back pain in the U.S. and worldwide prevalence forecasts (original data from Lancet and national surveys).
- Systematic review of chronic low back pain prevalence (PMC): age and sex prevalence ranges.
- Occupational prevalence study (PMC): anatomic location of low back pain.
This article is for general educational purposes and is not individual medical advice. Statistics describe populations, not any one person. If you have low back pain, consult a qualified provider for evaluation.
Media and press: Journalists and researchers are welcome to cite these statistics with attribution to the original primary source named alongside each figure, and a link to this page as the compiled reference. For commentary from a board-certified spine surgeon and neurosurgeon, contact Desert Spine and Pain in Phoenix, Arizona at (602) 566-9500.



