

Back Pain Statistics (2026): Prevalence, Cost, and Disability Data
Back pain is one of the most common medical conditions on earth. About 39% of U.S. adults report back pain in a given three-month window, an estimated 619 million people worldwide live with low back pain, and it remains the single leading cause of disability on the planet. Here is the current data for 2026, drawn only from primary sources.
- 39% of U.S. adults reported back pain in the past three months, more than any other pain site measured (CDC/NCHS).
- 619 million people worldwide had low back pain in 2020, projected to reach 843 million by 2050 (Lancet Rheumatology, GBD 2021).
- Low back pain has been the leading cause of years lived with disability globally since 1990 (Lancet Rheumatology, WHO).
- Up to 80% of adults experience at least one episode of low back pain in their lifetime.
- An estimated $200 billion a year is spent managing back pain in the U.S. across care and lost productivity.
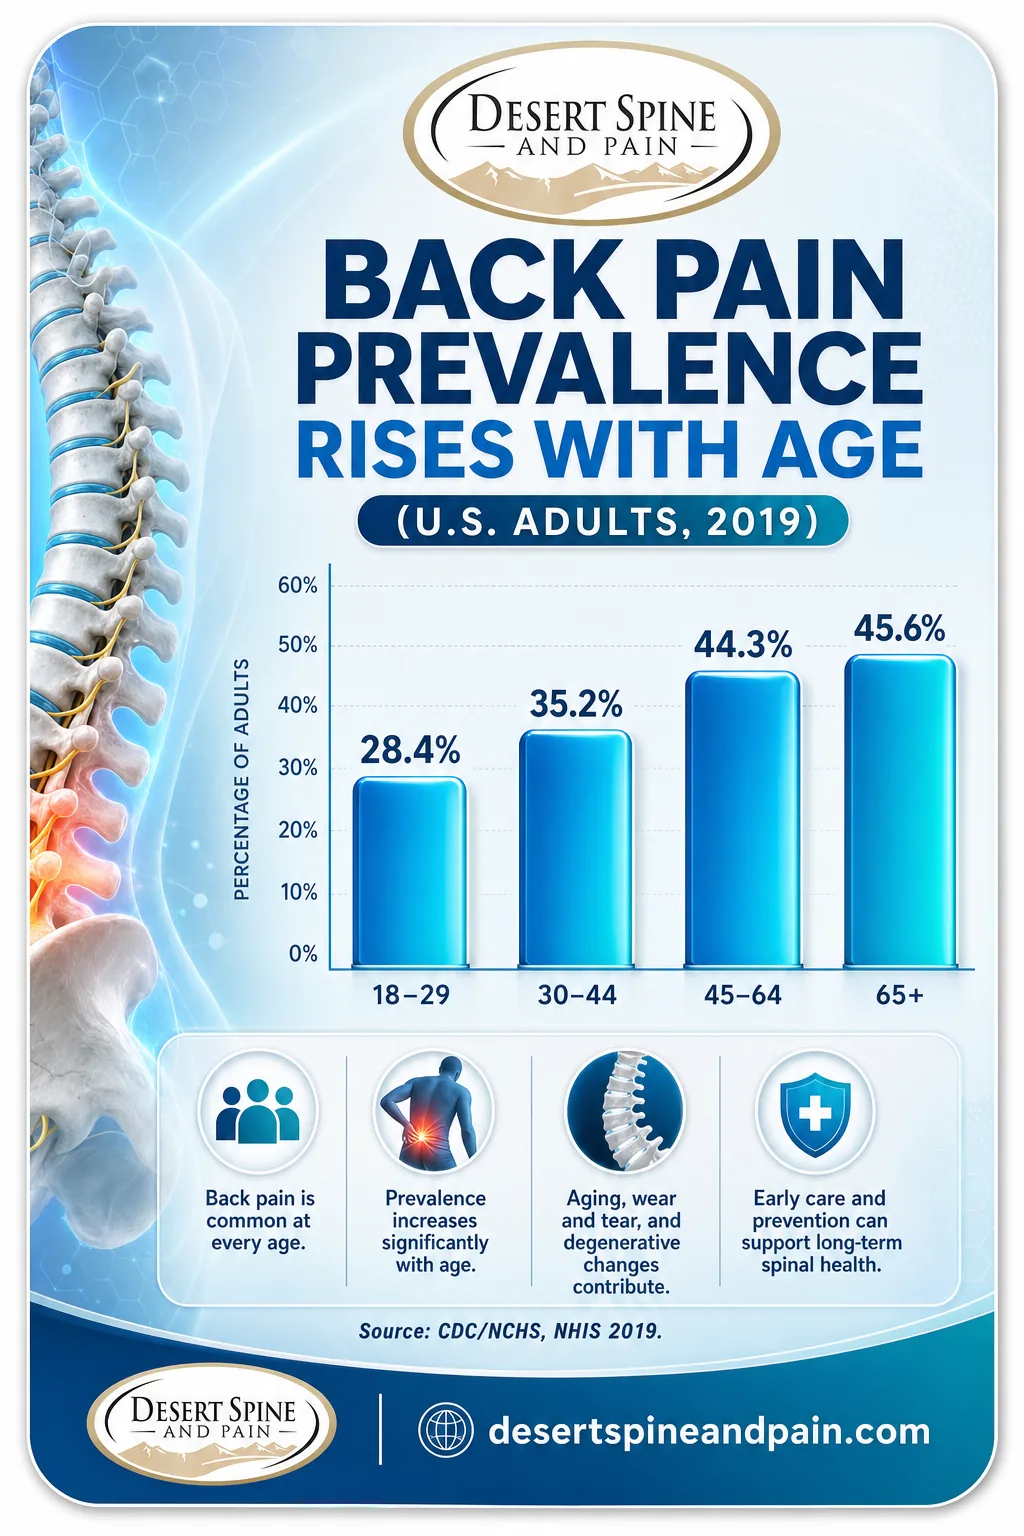
- Prevalence rises steeply with age, from about 28% of adults under 30 to roughly 45% of adults 45 and older.
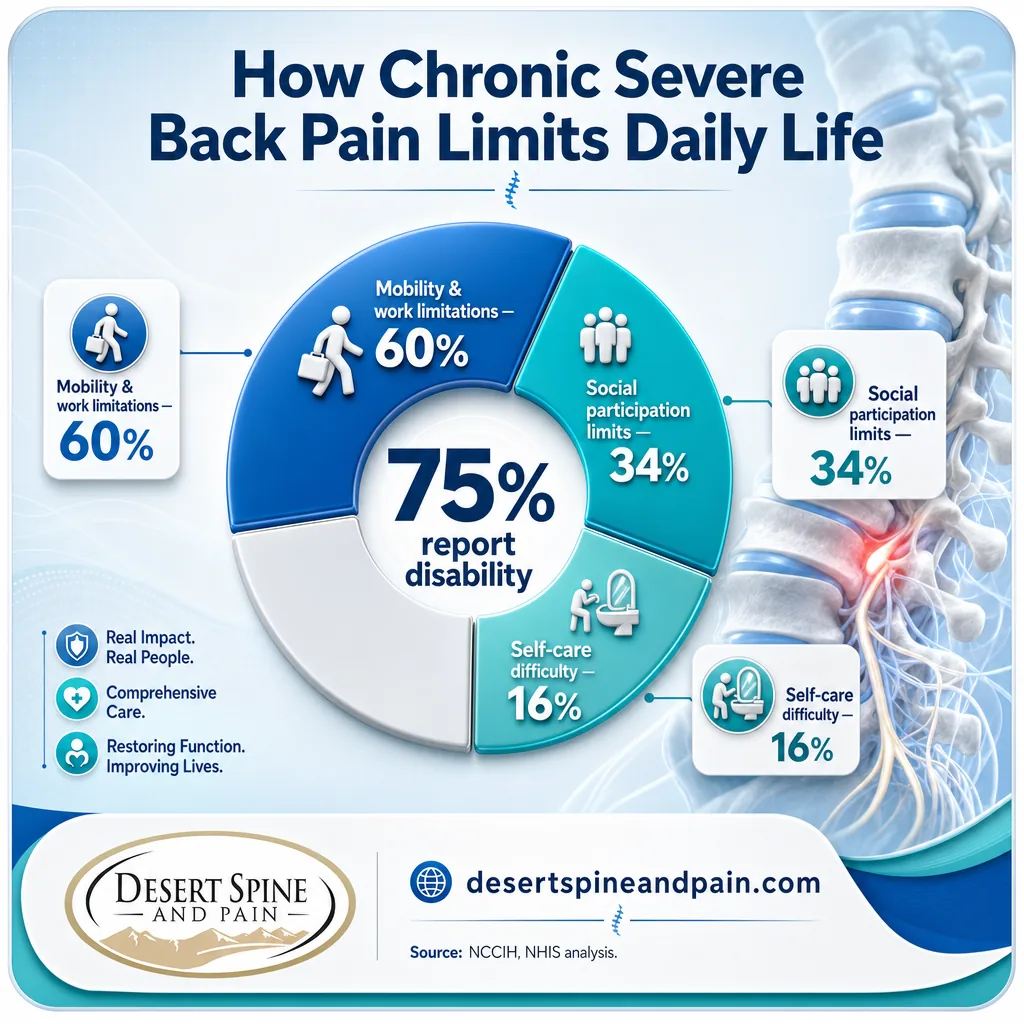
- About 75% of people with chronic severe back pain report disability affecting work, mobility, or daily life (NCCIH).
What's in This Guide
1 How Common Back Pain Is
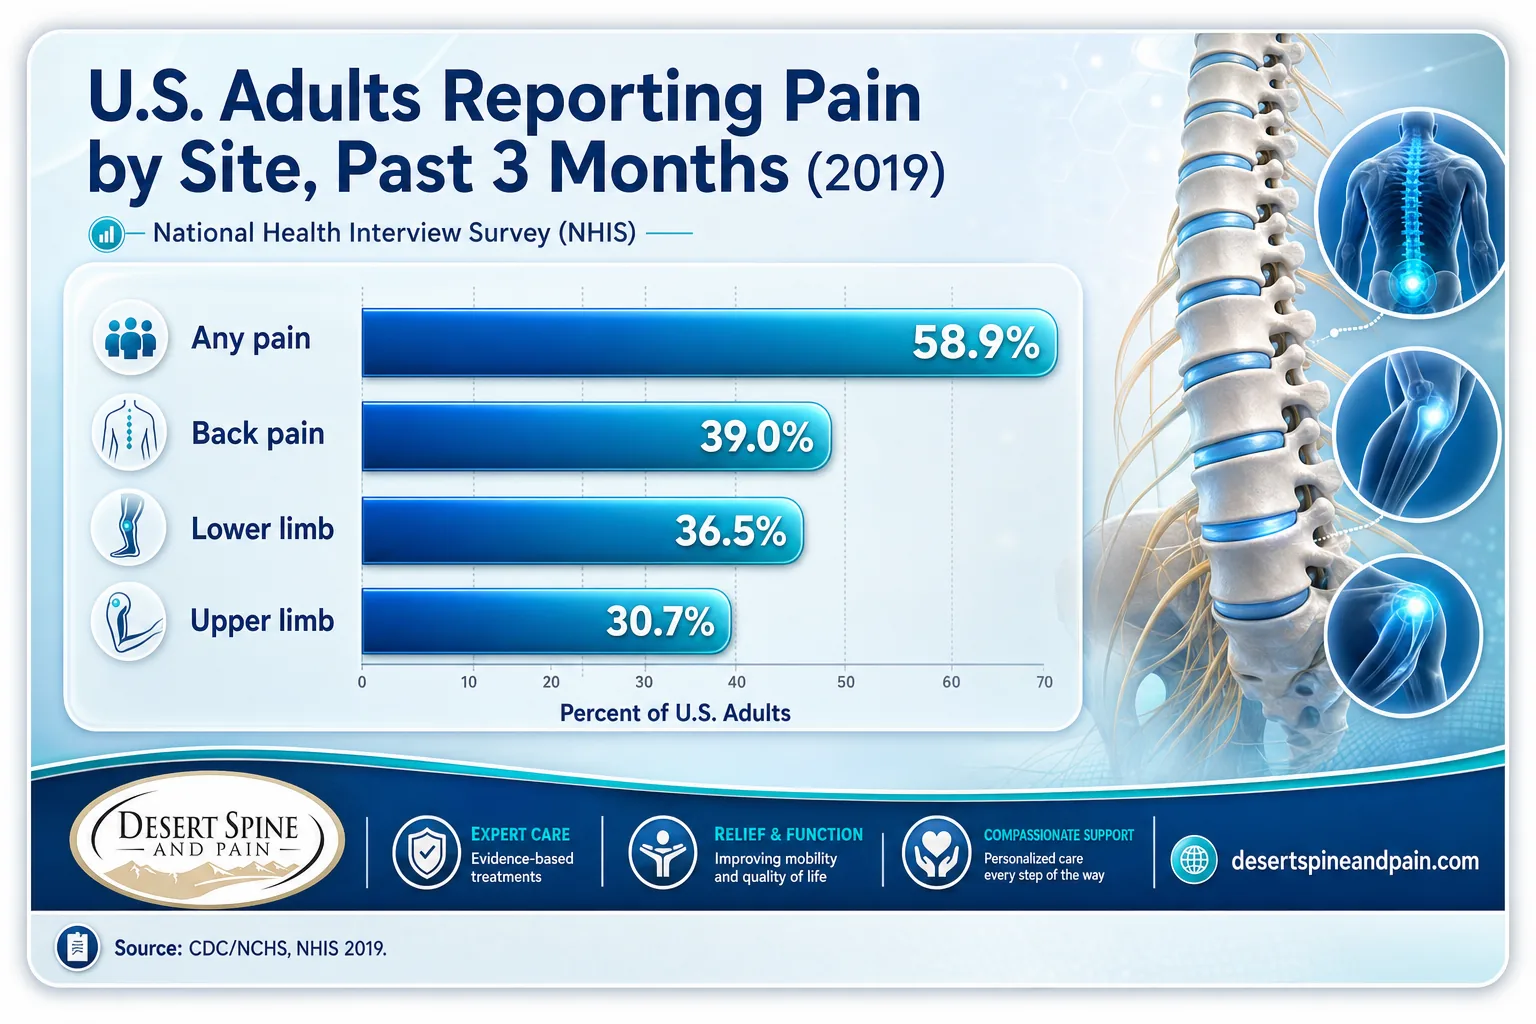
Back pain is not a rare complaint reserved for the injured or the elderly. It is close to a universal human experience. In the most recent national survey data, back pain was the most frequently reported pain location among U.S. adults, ahead of lower limb, upper limb, and every other site measured.
To put the 39% figure in context: in the same national survey, nearly three in five adults (58.9%) reported pain of any kind in the prior three months. Back pain led the list of specific sites, with 39.0% reporting it, followed by lower limb pain at 36.5% and upper limb pain at 30.7%. Back pain is, quite simply, the pain most Americans are most likely to feel.
U.S. Adults Reporting Pain by Site, Past 3 Months (NHIS 2019)
If back or neck pain has become part of your daily life, understanding the cause is the first step. A consultation can identify what is driving your pain and which treatments, from conservative care through advanced options, are the right fit.
Explore the conditions we treatSource: CDC / National Center for Health Statistics | World Health Organization
2 Who Gets Back Pain: Age, Sex, and Demographics
Back pain touches every age group, but not equally. The clearest single pattern in the data is age: prevalence climbs steadily across the adult lifespan and roughly doubles between young adulthood and later life.
Back Pain Prevalence by Age Group, U.S. Adults (NHIS 2019)
Sex is the second consistent pattern. Globally, low back pain is more prevalent in women than men across all age groups, a finding confirmed in the Global Burden of Disease analysis. Socioeconomic factors also track with prevalence: national survey data show back pain and its severity vary significantly by family income relative to the federal poverty level.
Worldwide, the age distribution has a notable peak. While prevalence keeps rising with age until around 80 to 89, the single largest group of people living with low back pain at any moment are those aged 50 to 54, simply because that band combines high prevalence with large population size.
Desert Spine and Pain Analysis: The "Working-Age Disability" Concentration
Combining two Tier 1 sources reveals why back pain is an economic problem, not just a medical one. The IASP reports that roughly 70% of years lost to low back pain disability fall on working-age people (20 to 65). CDC/NCHS data show back pain prevalence at 44.3% in the 45 to 64 band. Together these indicate the heaviest disability burden lands squarely on people in their peak earning and career years, not on the retired population many assume.
Formula: IASP working-age YLD share (70%) viewed against NHIS age-specific prevalence (44.3% at 45–64). Calculation and interpretation original to Desert Spine and Pain. Sources: IASP; CDC/NCHS.
Source: CDC / National Center for Health Statistics | International Association for the Study of Pain
See conservative, non-invasive treatment options3 Back Pain and Disability
The reason back pain dominates global health rankings is not that it is dangerous in the way a heart attack is. It is that it is both extremely common and extremely disabling, and it lasts. The standard measure public health researchers use is years lived with disability, and by that measure back pain has no equal.
The NCCIH analysis of national survey data breaks the disability down. Among people with chronic severe back pain, about 60% reported mobility problems and work limitations, 34% reported limits on social participation, and 16% reported difficulty with self-care tasks like dressing or washing. Almost all of them had at least one coexisting condition, most often arthritis, another musculoskeletal problem, anxiety, or depression.
Myth: "Back pain always means something is seriously wrong with your spine."
Most back pain is mechanical or nonspecific, meaning imaging does not show a single clear structural culprit, and most acute episodes improve. The IASP notes that disability is concentrated in a minority of severe cases, and that less than 28% of people with low back pain have severe disability even though that group accounts for 77% of the total disability burden. The takeaway is not that back pain is imaginary. It is that severity varies enormously, and a proper evaluation, not fear, is what separates a self-limited episode from one that needs advanced care.
Source: National Center for Complementary and Integrative Health | International Association for the Study of Pain
Learn about interventional pain management4 The Economic and Workforce Cost
Back pain is one of the most expensive conditions in American medicine, and most of that cost is invisible on a hospital bill. It shows up as missed work, lost productivity, and workers' compensation claims.
Back pain is also the second most common reason Americans visit a doctor and a leading driver of emergency-department visits. More than 26 million Americans aged 20 to 64 report frequent low back pain, and it is a top contributor to reduced work hours, lost productivity, and workers' compensation claims. For employers, the cost is not one large expense but thousands of small ones spread across absence, reduced output, and turnover.
| Cost Dimension | Figure | Source |
|---|---|---|
| Total annual U.S. back pain spend | ~$200 billion | StatPearls |
| Direct medical cost, chronic LBP | $28.2 billion/yr | J Pain / cost-of-illness |
| Americans 20–64 with frequent LBP | 26+ million | NIH clinical trial background |
| Americans disabled by LBP | ~2.5 million | NIH clinical trial background |
| Rank as cause of job-related disability | #1 | NCCIH |
This economic reality is also why back pain sits at the center of most personal injury cases involving a crash or fall. When a spine injury takes someone out of work, the medical and economic dimensions are inseparable, which is why timely, well-documented specialist care matters for patients and their attorneys alike.
Source: StatPearls (NCBI Bookshelf) | National Center for Complementary and Integrative Health
Book a consultation: (602) 566-95005 Acute vs. Chronic Back Pain
Most back pain is acute, meaning it lasts less than a few weeks, and most of it improves. The clinically important question is which episodes cross over into chronic pain, defined as pain on most or every day for three months or more, because that is where disability and cost concentrate.
The transition estimates vary widely by population and definition. Broad meta-analyses cited in recent community-cohort research suggest as many as 63% of acute episodes may transition to chronic pain, while other clinic-based figures are lower. What is consistent is that frequent and intense acute episodes are the ones most likely to become chronic, and that recurrence is common even after a full recovery. This is precisely why a least-invasive-first plan that addresses the pain early, before it entrenches, is so valuable.
Why the "least invasive first" sequence matters
Because most back pain improves and only a minority becomes severe, the right first step is rarely surgery. A structured plan starts with conservative and interventional options and reserves surgery for the cases that genuinely need it. Dr. David L. Greenwald, MD, FACS, is both a spine surgeon and a neurosurgeon, which means the full range of care, from injections through complex reconstruction, is evaluated by a single surgeon who can tell the difference.
Source: The Journal of Pain (community cohort study) | StatPearls (NCBI Bookshelf)
When back pain needs surgery: spine surgery options6 The Global Picture
The definitive global dataset is the Global Burden of Disease Study 2021, published in the Lancet Rheumatology. It analyzed data from 204 countries and territories and produced the numbers most widely cited by the WHO and health agencies worldwide.
Global Low Back Pain Prevalence: 2020 vs. 2050 Projection (millions)
The projected rise to 843 million cases by 2050 is driven mostly by population growth and aging rather than a rising rate of the condition itself. In fact, age-standardized prevalence actually declined about 10.4% between 1990 and 2020. Nearly 40% of the disability burden is attributable to modifiable risk factors, which means a large share of the global burden is, in principle, preventable through changes to workplace ergonomics, smoking, and weight.
Regional note
The GBD analysis found the highest occurrence of low back pain in Central Europe, Eastern Europe, and Australasia, and confirmed that low back pain is more prevalent in women than men in every age group globally. For a U.S.-specific breakdown, see our worldwide and demographic data articles in this series.
Source: The Lancet Rheumatology (GBD 2021) | Institute for Health Metrics and Evaluation
Meet Dr. Greenwald: spine surgeon and neurosurgeon7 Every Statistic in One Table
| Statistic | Figure | Source | Year |
|---|---|---|---|
| U.S. adults reporting back pain, past 3 months | 39.0% | CDC/NCHS (NHIS) | 2019 |
| U.S. adults reporting any pain, past 3 months | 58.9% | CDC/NCHS (NHIS) | 2019 |
| Lifetime prevalence of low back pain | Up to 80% | NIH background | 2016 |
| Adults reporting LBP in a given month | ~25% | NIH background | 2016 |
| Back pain prevalence, age 18–29 | 28.4% | CDC/NCHS (NHIS) | 2019 |
| Back pain prevalence, age 30–44 | 35.2% | CDC/NCHS (NHIS) | 2019 |
| Back pain prevalence, age 45–64 | 44.3% | CDC/NCHS (NHIS) | 2019 |
| Back pain prevalence, age 65+ | 45.6% | CDC/NCHS (NHIS) | 2019 |
| Global low back pain cases | 619 million | Lancet Rheumatology (GBD 2021) | 2020 |
| Projected global cases by 2050 | 843 million | Lancet Rheumatology (GBD 2021) | 2050 |
| Projected increase 2020–2050 | 36.4% | Lancet Rheumatology (GBD 2021) | 2050 |
| LBP disability from modifiable risk factors | 38.8% | Lancet Rheumatology (GBD 2021) | 2021 |
| Rank as global cause of disability (YLDs) | #1 since 1990 | WHO / Lancet Rheumatology | 2023 |
| Chronic severe back pain patients reporting disability | ~75% | NCCIH | 2023 |
| Working-age share of LBP disability years | ~70% | IASP | 2021 |
| Annual U.S. back pain spend | ~$200 billion | StatPearls | 2025 |
| Direct medical cost, chronic LBP | $28.2 billion/yr | J Pain cost-of-illness | 2024 |
| Chronic LBP prevalence, U.S. adults | 5–10% | NIH background | 2016 |
| Acute-to-chronic transition (upper estimate) | Up to 63% | J Pain / meta-analyses | 2024 |
Frequently Asked Questions
How common is back pain?
Is back pain the leading cause of disability?
How much does back pain cost the U.S. each year?
What percentage of acute back pain becomes chronic?
Does back pain get more common with age?
Methodology and Sources
Every statistic in this article is drawn from a Tier 1 primary source: a government agency, a peer-reviewed study, or a major research institution. No blog-to-blog citations are used. Where estimates vary by methodology, ranges are shown rather than a single figure.
Primary sources:
- CDC / National Center for Health Statistics: National Health Interview Survey data on back pain prevalence by site, age, sex, and income.
- World Health Organization: Low back pain fact sheet.
- The Lancet Rheumatology: Global Burden of Disease Study 2021: global, regional, and national burden of low back pain, 1990–2020, with projections to 2050 (Ferreira et al.).
- Institute for Health Metrics and Evaluation (IHME): GBD analysis and press summary.
- National Center for Complementary and Integrative Health (NCCIH): analysis of disability among people with chronic severe back pain.
- International Association for the Study of Pain (IASP): global burden of low back pain fact sheet.
- StatPearls (NCBI Bookshelf): low back pain evaluation and management, economic burden.
- The Journal of Pain: community-based cohort research on acute-to-chronic transition.
This article is for general educational purposes and is not individual medical advice. Statistics describe populations, not any one person. If you have back or neck pain, consult a qualified provider for evaluation.
Media and press: Journalists and researchers are welcome to cite these statistics with attribution to the original primary source named alongside each figure, and a link to this page as the compiled reference. For commentary from a board-certified spine surgeon and neurosurgeon, contact Desert Spine and Pain in Phoenix, Arizona at (602) 566-9500.



