

Back Pain Statistics Worldwide (2026): Global and Regional Data
Back pain is a global condition, but it is not distributed evenly. About 619 million people worldwide have low back pain, rates vary roughly threefold between the highest and lowest countries, and the burden is shifting toward the developing world. Here is the 2026 international data, from primary sources only.
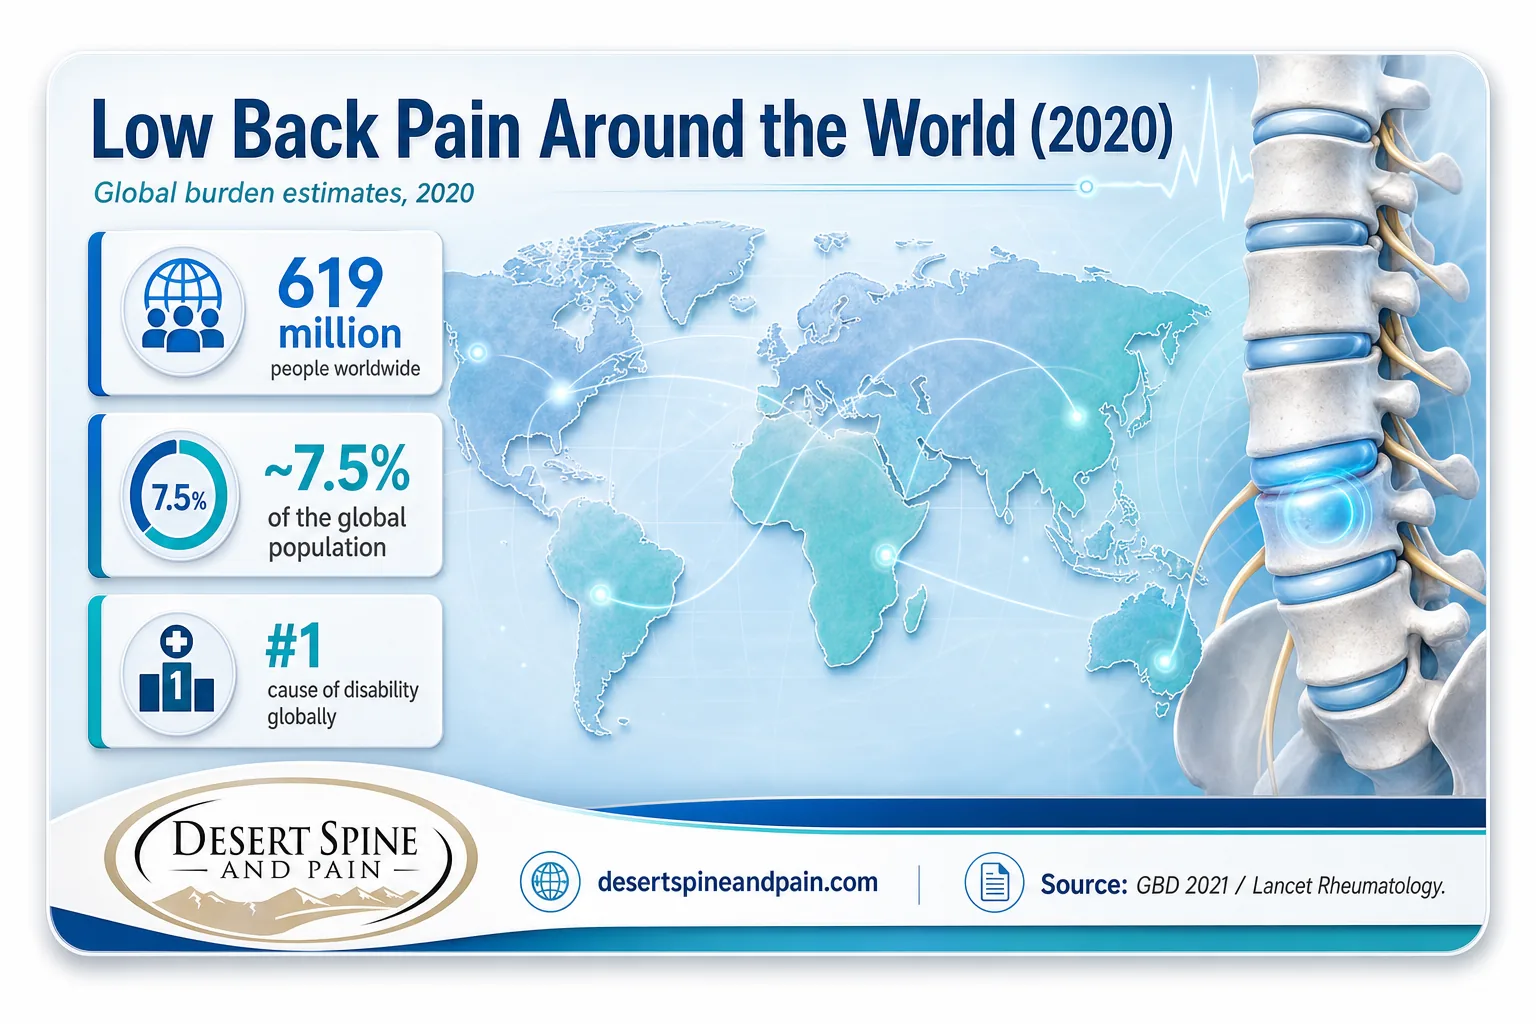
- 619 million people worldwide had low back pain in 2020, about 7.5% of the global population.
- Cases are projected to reach 843 million by 2050, a 36% increase.
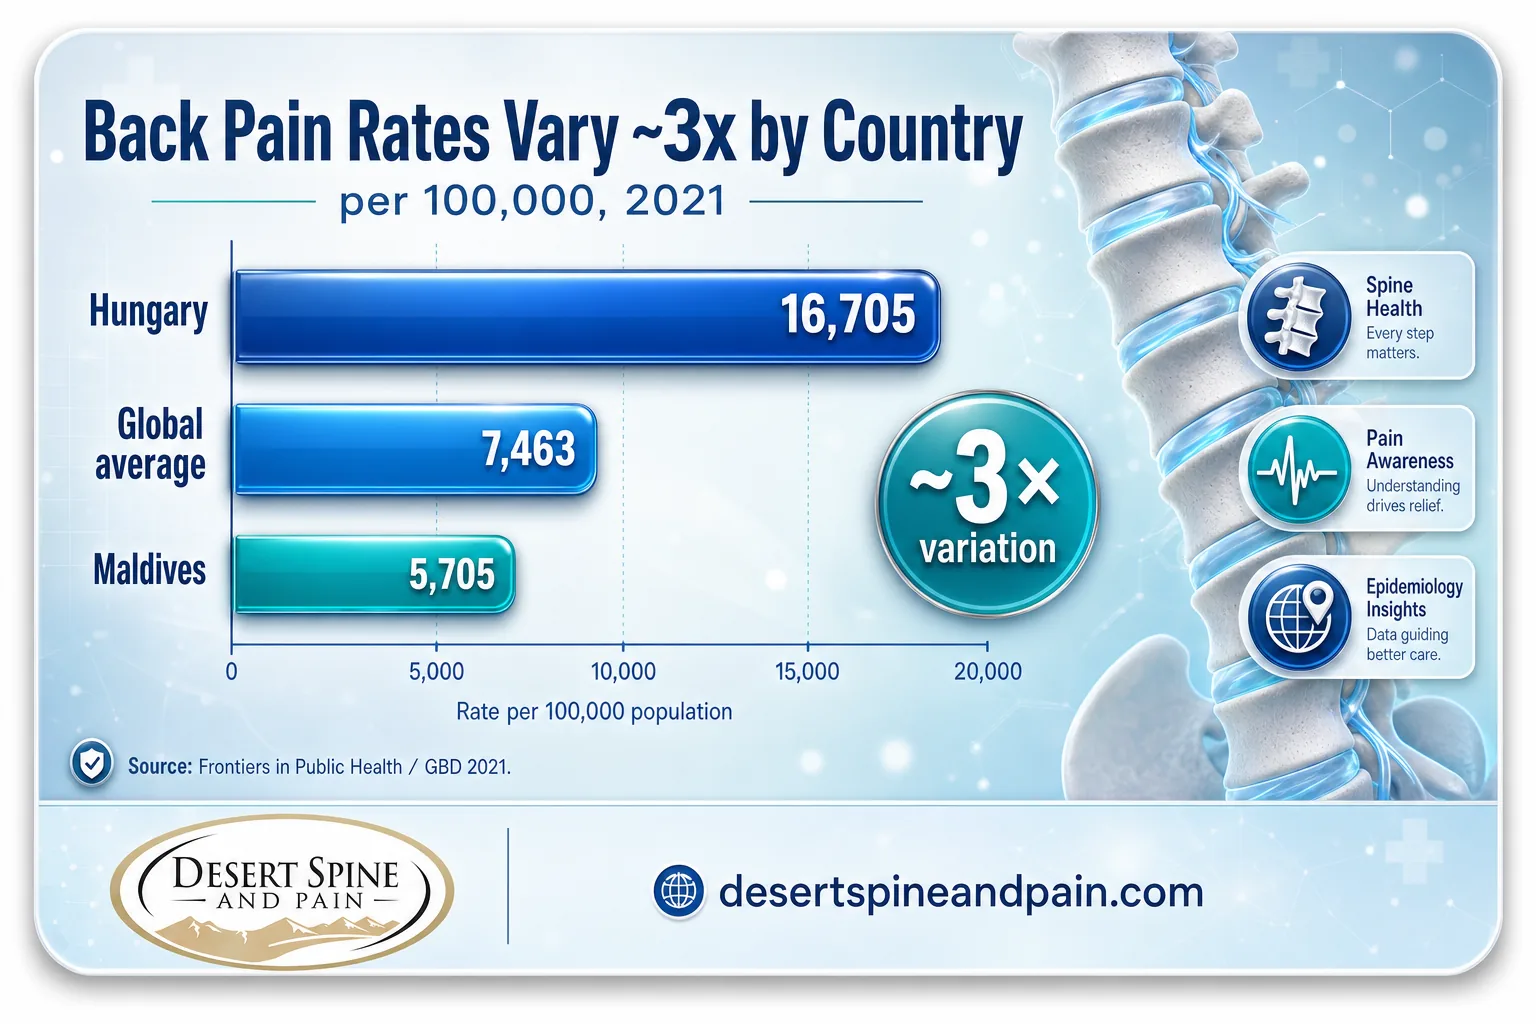
- Hungary has the highest rate (~16,705 per 100,000); the Maldives the lowest (~5,705).
- India, China, and the U.S. have the highest total case counts.
- Low back pain is the #1 cause of disability in most countries worldwide.
- The burden is rising fastest in low- and middle-income countries.
- The global median 1-year prevalence among adults is about 37%.
What's in This Guide
1 The Global Picture
Low back pain is one of the most common health conditions on the planet, and the single leading cause of disability worldwide. The definitive source is the Global Burden of Disease Study, which analyzed 204 countries and territories.
In 2020, an estimated 619 million people worldwide reported low back pain, equal to roughly 7.5% of the global population, and the median one-year period prevalence among adults is about 37%. Low back pain has been the leading cause of years lived with disability since 1990 in most countries, regardless of income level. For the full U.S. and headline data, see our back pain statistics. This article focuses on how back pain varies around the world.
Wherever back pain occurs, the principles of good care are the same: start with the least invasive effective treatment, and reserve surgery for those who truly need it.
Explore the spine conditions we treatSource: The Lancet Rheumatology (GBD 2021) | International Association for the Study of Pain
2 Highest and Lowest Countries
When back pain is measured as an age-standardized rate, which adjusts for differences in population age, the variation between countries is striking, roughly threefold from the highest to the lowest.
In 2021, Hungary had the highest age-standardized prevalence rate of low back pain at about 16,705 per 100,000 people, while the Maldives had the lowest at about 5,705 per 100,000, a nearly threefold difference. Hungary also reported the highest incidence rate. These differences reflect a mix of factors: occupational patterns, population age structure, lifestyle, healthcare systems, and how consistently each country collects data on back pain.
Age-Standardized Low Back Pain Rate: Highest vs. Lowest Country (per 100,000, 2021)
Source: Frontiers in Public Health (GBD 2021 analysis)
See conservative, non-invasive care options3 Where the Most People Live With It
Rates per capita tell one story, but sheer numbers of people tell another. By total case count, the most populous nations dominate, even when their per-person rates are moderate.
India had the highest number of prevalent low back pain cases in the world at an estimated 68.5 million, and China, India, and the United States together account for the largest national case counts. For new cases each year, China and India again lead, at roughly 29.8 million incident cases each. The distinction matters: a country can have a relatively low rate per person yet still carry an enormous absolute burden because of its population size, which shapes where the greatest need for spine care exists.
Source: Frontiers in Public Health (GBD 2021) | Global burden of low back pain analysis (GBD 2021)
Meet Dr. Greenwald: spine surgeon and neurosurgeon4 Regional Patterns
Zooming out from individual countries to world regions reveals clear geographic clusters of higher and lower back pain burden.
The regions with the highest occurrence of low back pain are Central Europe, Eastern Europe, and Australasia. South Asia carries one of the largest regional case totals at around 117 million. What drives the growth differs by region: in Asia and Latin America, the main force behind rising case numbers is population aging, while in most other regions it is overall population growth. This regional lens helps explain why the global total keeps climbing even as the age-adjusted rate holds steady or declines.
Source: Institute for Health Metrics and Evaluation | Statista (Lancet Rheumatology data)
Explore interventional pain management5 The Income Gradient
One of the most important and counterintuitive findings in global back pain research concerns income. The relationship between a country's wealth and its back pain burden is not what many would expect.
Based on GBD 2021 data, the disability rate from low back pain is currently highest in high-income countries, at about 1,094 disability-adjusted life years per 100,000. Yet the burden is projected to rise fastest in low- and middle-income countries across Asia, Africa, and the Middle East, where health and social systems may be less prepared to cope. In some lower-income settings, chronic low back pain prevalence among workers has been estimated as high as 52%, and because over 80% of back pain costs come from lost productivity rather than direct care, the economic stakes in these regions are considerable.
Myth: "Back pain is a rich-country, desk-job problem."
The global data say otherwise. Back pain affects people across high-, middle-, and low-income countries alike, and some of the highest chronic rates appear among manual workers in lower-income settings, where physically demanding labor, not desk work, is the norm. Back pain is the leading cause of disability in most countries on earth regardless of wealth. It is a near-universal human condition, not a lifestyle complaint of the affluent.
Desert Spine and Pain Analysis: The Coming Shift
Two findings, combined, point to a global turning point. Today the disability rate is highest in wealthy nations (about 1,094 per 100,000), yet the fastest growth is now in low- and middle-income countries. As populations there age and take on more sedentary and occupational risk, the center of gravity of the world's leading cause of disability is shifting toward regions with the least spine-care infrastructure. It is a reminder that the least-invasive-first model, which conserves resources by avoiding unnecessary imaging and surgery, is not only good medicine but a globally scalable one.
Interpretation of the high-income disability rate (1,094 per 100,000) against the faster growth trajectory in LMICs. Calculation and interpretation original to Desert Spine and Pain. Sources: GBD 2021; Frontiers in Medicine.
Source: Frontiers in Medicine (Asia-Pacific LBP burden) | International Association for the Study of Pain
Explore spine surgery options6 The Global Outlook to 2050
The forecast for back pain worldwide is one of steady growth in total cases, with the global rate holding roughly stable.
Global Low Back Pain Cases Over Time (millions)
By 2050, the global number of low back pain cases is projected to reach 843 million, an increase of roughly 36% from 2020. The prevalence rate itself is expected to stay near 7% of the world's population, meaning the rise is driven by more people and an older population rather than a higher individual risk. The global trend line is clear: back pain is not going away, and demand for effective, appropriate spine care will keep growing for decades.
Source: Statista (Lancet Rheumatology forecast) | The Lancet Rheumatology (GBD 2021)
Book a consultation: (602) 566-95007 Every Statistic in One Table
| Statistic | Figure | Source | Year |
|---|---|---|---|
| Global low back pain cases | 619 million | GBD 2021 / Lancet | 2020 |
| Global cases (earlier estimate) | 577 million | GBD / IASP | 2017 |
| Projected global cases by 2050 | 843 million | GBD 2021 / Lancet | 2050 |
| Projected increase 2020–2050 | ~36% | GBD 2021 / Lancet | 2050 |
| Global population affected | ~7.5% | GBD / IASP | 2020 |
| Global age-standardized prevalence rate | 7,463 per 100,000 | GBD 2021 analysis | 2021 |
| Global median 1-year period prevalence | ~37% | Peer-reviewed / GBD | 2026 |
| Highest national rate (Hungary) | 16,705 per 100,000 | Frontiers / GBD 2021 | 2021 |
| Lowest national rate (Maldives) | 5,705 per 100,000 | Frontiers / GBD 2021 | 2021 |
| Highest case count (India) | 68.5 million | Frontiers / GBD 2021 | 2021 |
| Highest incident cases (China, India) | ~29.8 million each | Frontiers / GBD 2021 | 2021 |
| South Asia regional cases | ~117 million | Statista / Lancet | 2020 |
| Highest-occurrence regions | C. Europe, E. Europe, Australasia | IHME | 2023 |
| High-income disability rate (DALYs) | 1,094 per 100,000 | Frontiers / GBD 2021 | 2021 |
| Chronic LBP in some LMIC workers | ~52% | IASP | 2025 |
| Share of LBP costs that are indirect | 80%+ | IASP | 2025 |
| Rank as global cause of disability | #1 since 1990 | GBD / WHO | 2023 |
Frequently Asked Questions
How many people have back pain worldwide?
Which country has the highest rate of back pain?
Which countries have the most people with back pain?
Is back pain worse in rich or poor countries?
Is back pain the leading cause of disability worldwide?
Methodology and Sources
Every statistic in this article is drawn from a Tier 1 primary source: the Global Burden of Disease Study, a major research institution, or a peer-reviewed analysis of that data. Statista figures cited here reproduce Lancet Rheumatology and GBD source data. No blog-to-blog citations are used.
Primary sources:
- The Lancet Rheumatology / GBD 2021: global, regional, and national burden of low back pain, 1990-2020, with projections to 2050.
- Institute for Health Metrics and Evaluation (IHME): regional occurrence and growth drivers.
- Frontiers in Public Health (2025): national prevalence rankings, including Hungary, the Maldives, and India.
- Frontiers in Medicine (2026): Asia-Pacific burden and the income (SDI) gradient.
- Peer-reviewed GBD analysis (PMC): country trends and case counts.
- International Association for the Study of Pain (IASP): global burden, cost, and LMIC prevalence.
- Statista: reproducing Lancet Rheumatology regional and forecast data.
This article is for general educational purposes and is not individual medical advice. Statistics describe populations, not any one person. National comparisons are affected by differences in data collection, and figures for some low- and middle-income countries rely on modeled estimates. If you have back pain, consult a qualified provider for evaluation.
Media and press: Journalists and researchers are welcome to cite these statistics with attribution to the original primary source named alongside each figure, and a link to this page as the compiled reference. For commentary from a board-certified spine surgeon and neurosurgeon, contact Desert Spine and Pain in Phoenix, Arizona at (602) 566-9500.



