
Arizona Health Insurance Statistics (2026): Coverage, Costs, and the Uninsured
About 10.3% of Arizonans had no health insurance in 2024, higher than the national average, and the 2026 plan year brought a 46.3% average gross premium increase, the loss of enhanced subsidies, and an all-HMO marketplace. For patients, coverage has rarely been more expensive or more restrictive.
- Arizona's uninsured rate was 10.3% in 2024 (U.S. Census/ACS), above the 8.2% national average and 43rd among the states.
- Marketplace insurers received a weighted-average approved gross rate increase of 46.3% for 2026, one of the steepest in the country.
- 357,144 Arizonans enrolled in a 2026 marketplace plan, a 15.6% drop year over year after enhanced subsidies expired.
- Arizona's 2026 marketplace is HMO-only: Aetna exited and Blue Cross Blue Shield of Arizona dropped its PPO plans, leaving 7 carriers.
- About 83% of Arizona enrollees qualified for premium subsidies, averaging $555/month, paying a net average of $133/month, but the income cutoff for any subsidy returned in 2026.
- Approved individual rate hikes ranged from 18% (Antidote) to nearly 49% (Arizona Complete Health and BCBSAZ HMO).
What's in This Report
1Arizona's Uninsured Rate
Arizona has long carried a higher share of uninsured residents than most states, and 2024 was no exception. According to U.S. Census Bureau American Community Survey data analyzed by America's Health Rankings, 10.3% of Arizona's population had no private or public health coverage, ranking the state 43rd in the nation and well above the 8.2% U.S. average.
Being uninsured is not a neutral status. The research summarized by America's Health Rankings links a lack of coverage to higher rates of premature death, later-stage cancer diagnosis, reduced access to preventive care, and higher odds of carrying medical debt. Nearly two-thirds of uninsured working-age adults nationally say the reason they go without coverage is that they cannot afford it.
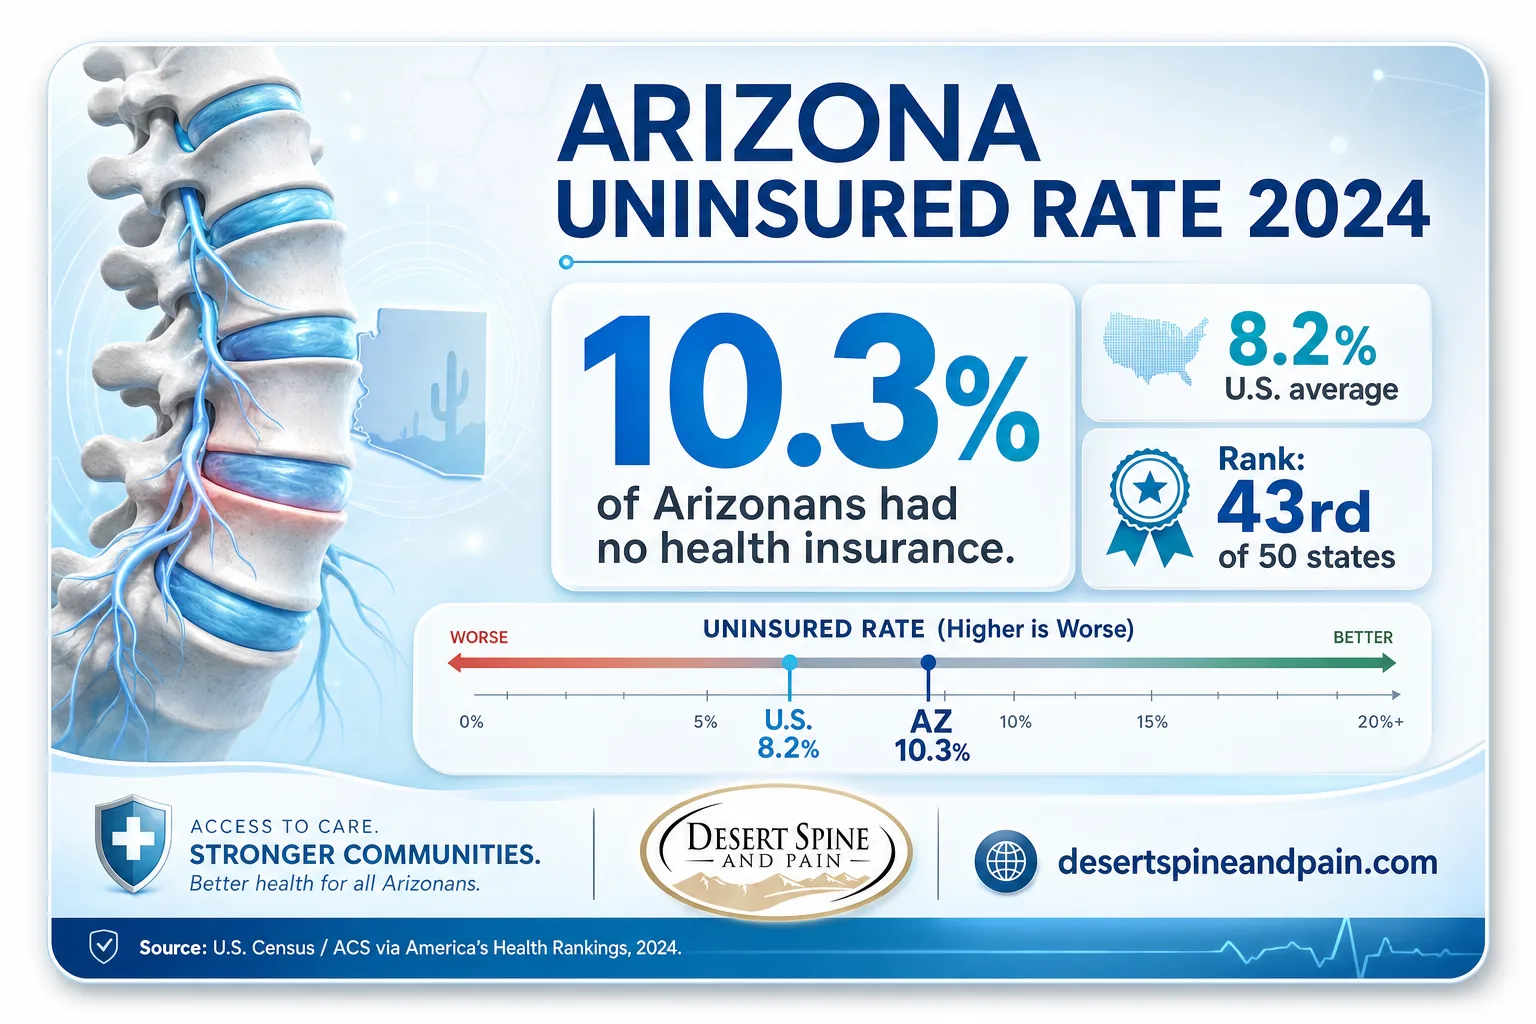
Source: America's Health Rankings (Census/ACS) | U.S. Census Bureau, P60-284
Explore conservative, least-invasive-first care2The 2026 Premium Shock
The biggest health insurance story in Arizona for 2026 is cost. The Arizona Department of Insurance and Financial Institutions (DIFI) approved a weighted-average gross rate increase of 46.3% for full-price marketplace plans, among the steepest in the nation. For a 40-year-old individual in Maricopa County, an unsubsidized Silver plan averaged roughly $685 per month before assistance. For a family of four, a Silver plan could exceed $2,100 per month pre-subsidy.
Increases were not uniform. Approved individual-market rate changes ranged from 18% at the low end to nearly 49% at the high end, depending on the carrier.
| Arizona Marketplace Insurer | Approved 2026 Rate Change |
|---|---|
| Antidote Health Plan of Arizona | 18.0% |
| Imperial Insurance | 19.3% |
| Oscar Health Plan | 26.1% |
| Cigna HealthCare of AZ | 33.8% |
| UnitedHealthcare of Arizona | 44.3% |
| Blue Cross Blue Shield of Arizona (HMO) | 48.7% |
| Arizona Complete Health (Health Net) | 48.9% |
| Aetna CVS Health / Banner Health | Exited the market |
| Blue Cross Blue Shield of Arizona (PPO) | Exited the market |
Not exactly. The 46.3% figure is the weighted-average increase on full-price (pre-subsidy) plans. What each household actually pays depends on age, county, plan, and subsidy. Because enhanced subsidies expired at the end of 2025, many subsidized enrollees saw their net premium rise by even more than 46%, while a few paid less. Always check your specific plan, not the headline average.
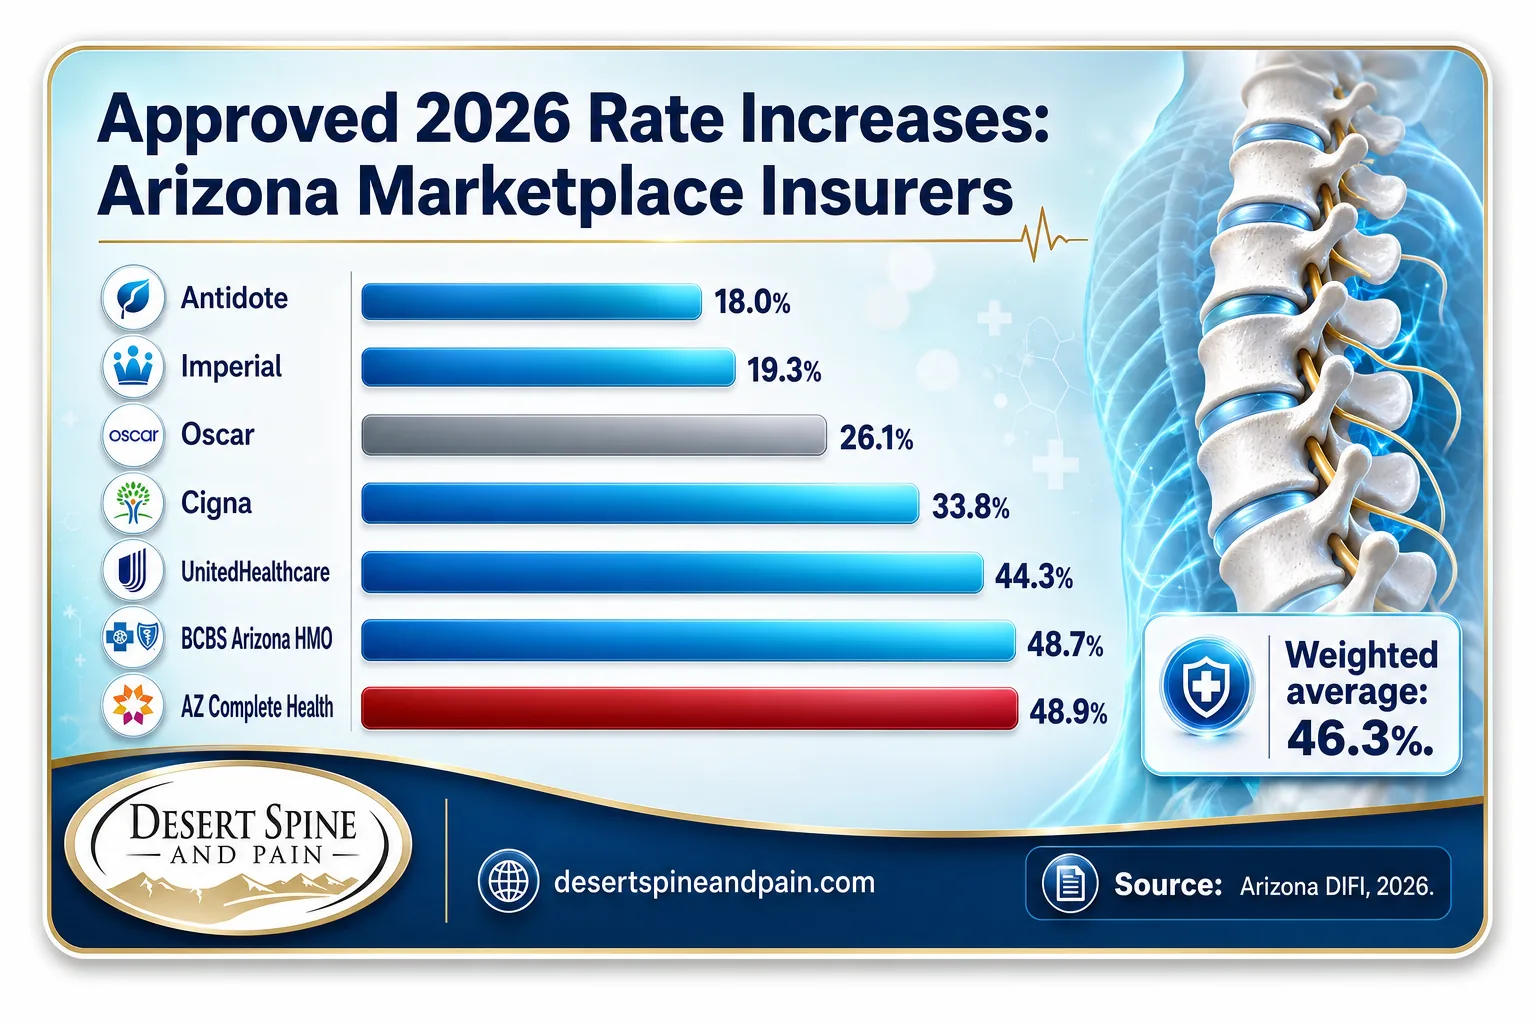
Source: Arizona DIFI rate filings | healthinsurance.org (DIFI/CMS data)
How out-of-network coverage works3Enrollment and the Subsidy Cliff
After several years of record marketplace growth, Arizona enrollment reversed course for 2026. A total of 357,144 residents selected a plan during open enrollment, down 15.6% from the prior year. The decline tracks with the expiration of the enhanced premium tax credits that had made coverage dramatically cheaper since 2021.
For those who still qualified, subsidies remained substantial: an average of $555 per month in advance premium tax credits, bringing the average net premium down to about $133 per month, and roughly 18% of enrollees paid less than $10 a month. But the enhanced-subsidy expiration reinstated the income cliff at 400% of the federal poverty level. In 2026, a single person earning above roughly $62,600, or a family of four above about $128,600, generally receives no premium subsidy at all.
Two forces are pushing in the same direction. Census data put Arizona's uninsured rate at 10.3% in 2024, and CMS data show 2026 marketplace enrollment fell 15.6% as subsidies shrank. Rising net premiums plus a returning subsidy cliff create pressure for more residents to drop or downgrade coverage, which historically raises the uninsured rate. The takeaway for patients: coverage gaps and higher out-of-pocket exposure are likely to grow in Arizona, making it more important than ever to understand benefits before care. Calculation and interpretation original to Desert Spine and Pain, based on U.S. Census/ACS (2024) and CMS (2026) data.
Source: CMS Open Enrollment data via healthinsurance.org | CMS Marketplace Products
Questions about coverage? Call (602) 566-95004Fewer Carriers, an HMO-Only Market
The structure of Arizona's marketplace changed in ways that directly affect access to specialists. Seven private carriers offer 2026 marketplace coverage, but the mix shifted: Aetna (Banner|Aetna) exited the individual market entirely, and Blue Cross Blue Shield of Arizona did not renew its PPO plans. The result is that, for 2026, all marketplace carriers in Arizona offer HMO plans exclusively.
The shift from PPO to HMO matters for anyone who values choice of provider. HMO plans generally require referrals and restrict coverage to in-network providers, with little or no out-of-network benefit. For patients who want a specific spine surgeon or a technique not offered inside their plan's network, that can make out-of-network planning essential rather than optional.
On a PPO, seeing an out-of-network specialist often meant partial reimbursement after the deductible. On an HMO, out-of-network care is frequently not covered at all, which shifts more of the decision to the patient. That does not mean specialty care is unavailable, it means understanding your benefits, and your self-pay and reimbursement options, matters more than it used to. Confirm details with your plan and provider before assuming a treatment is out of reach.
Source: healthinsurance.org (DIFI/CMS) | Arizona DIFI
Explore our spine surgery options5What It Means for Spine and Pain Patients
For Arizonans dealing with back pain, neck pain, or a spine condition, the 2026 picture adds up to higher costs, narrower networks, and more people at risk of being uninsured or underinsured. That combination makes it easy to delay care, which is exactly the wrong move when nerve compression or a progressing spine problem is involved.
Desert Spine and Pain is led by Dr. David L. Greenwald, MD, FACS, who is both a spine surgeon and a neurosurgeon, and the practice works with patients regardless of network status, including out-of-network patients and those referred through personal injury attorneys. In an HMO-dominated market, that flexibility matters: the administrative team verifies benefits, explains costs up front, and assists with the paperwork for reimbursement or appeal, so patients can focus on their health. For attorneys, the practice coordinates documentation directly with legal teams and offers 24/7 concierge response.
If your claim is denied, remember that a denial is frequently about paperwork or network rules rather than whether you need the care. For the national picture on how often claims are rejected and overturned, see our companion report on health insurance claim denial statistics. This article is general information, not medical or financial advice; consult a qualified professional about your specific situation.
Source: America's Health Rankings | Arizona AHCCCS
Find our Phoenix locationArizona Health Insurance Statistics: Summary Table (2026)
| Statistic | Figure | Source | Year |
|---|---|---|---|
| Arizona uninsured rate | 10.3% | Census / ACS via AHR | 2024 |
| National uninsured rate | 8.2% | Census / ACS | 2024 |
| Arizona national rank (coverage) | 43rd | America's Health Rankings | 2024 |
| Weighted-average approved gross rate increase | 46.3% | DIFI / ACA Signups | 2026 |
| Avg. unsubsidized Silver premium (40-yr-old, Maricopa) | $685/mo | DIFI rate filings | 2026 |
| Avg. Silver premium, family of four (pre-subsidy) | ~$2,100/mo | DIFI rate filings | 2026 |
| Lowest approved insurer rate increase (Antidote) | 18.0% | DIFI | 2026 |
| Highest approved insurer rate increase (AZ Complete Health) | 48.9% | DIFI | 2026 |
| Marketplace enrollees | 357,144 | CMS PUF | 2026 |
| Year-over-year enrollment change | -15.6% | CMS | 2026 |
| Enrollees receiving premium subsidies | 83% | CMS PUF | 2026 |
| Average monthly premium subsidy | $555 | CMS PUF | 2026 |
| Average net monthly premium (subsidized) | $133 | CMS PUF | 2026 |
| Enrollees paying under $10/month | ~18% | CMS PUF | 2026 |
| Marketplace carriers | 7 | DIFI | 2026 |
| On-exchange PPO plans available | 0 (HMO-only) | DIFI / CMS | 2026 |
| Medicaid transitions during unwinding (cumulative) | 134,000+ | CMS | 2024 |
| Subsidy income cutoff, single (400% FPL) | ~$62,600 | HealthCare.gov / IRS | 2026 |
| Subsidy income cutoff, family of four (400% FPL) | ~$128,600 | HealthCare.gov / IRS | 2026 |
Frequently Asked Questions
What percentage of Arizona is uninsured?
How much did Arizona health insurance premiums go up in 2026?
How many Arizonans have marketplace health insurance?
Does Arizona have PPO plans on the marketplace for 2026?
Can I see an out-of-network spine specialist in Arizona if I have an HMO?
Methodology & Sources
How we compiled this report
All figures are drawn from Tier 1 primary sources: federal agencies, the state insurance regulator, and nonpartisan research organizations. Arizona's uninsured rate comes from U.S. Census Bureau American Community Survey (1-Year, 2024) data as analyzed by America's Health Rankings. Premium and rate-change data come from the Arizona Department of Insurance and Financial Institutions (DIFI) approved rate filings, with weighted-average calculations from ACA Signups. Enrollment, subsidy, and plan-mix figures come from the CMS Marketplace Open Enrollment Period Public Use Files (2026). Medicaid figures reference Arizona's AHCCCS program.
Premium figures are approximate and based on unsubsidized rates for representative enrollees (a 40-year-old individual and a family of four in Maricopa County); actual costs vary by age, ZIP code, household size, tobacco use, and income. The uninsured rate reflects 2024 ACS data, the most recent available at publication. Marketplace figures reflect the 2026 plan year.
- U.S. Census Bureau, American Community Survey 1-Year Dataset (2024), via America's Health Rankings
- Arizona Department of Insurance and Financial Institutions (DIFI), 2026 approved rate filings
- Centers for Medicare & Medicaid Services (CMS), 2026 Marketplace Open Enrollment Period Public Use Files
- ACA Signups, Arizona 2026 final gross rate change analysis
- Arizona Health Care Cost Containment System (AHCCCS)
You are welcome to cite these statistics with attribution to the original primary sources named above (U.S. Census Bureau, Arizona DIFI, CMS, America's Health Rankings, AHCCCS). When referencing the Desert Spine and Pain Analysis, please attribute the calculation to Desert Spine and Pain. This article is general information and not medical or financial advice.