
Health Insurance Claim Denial Statistics (2026): What the Latest Data Reveals
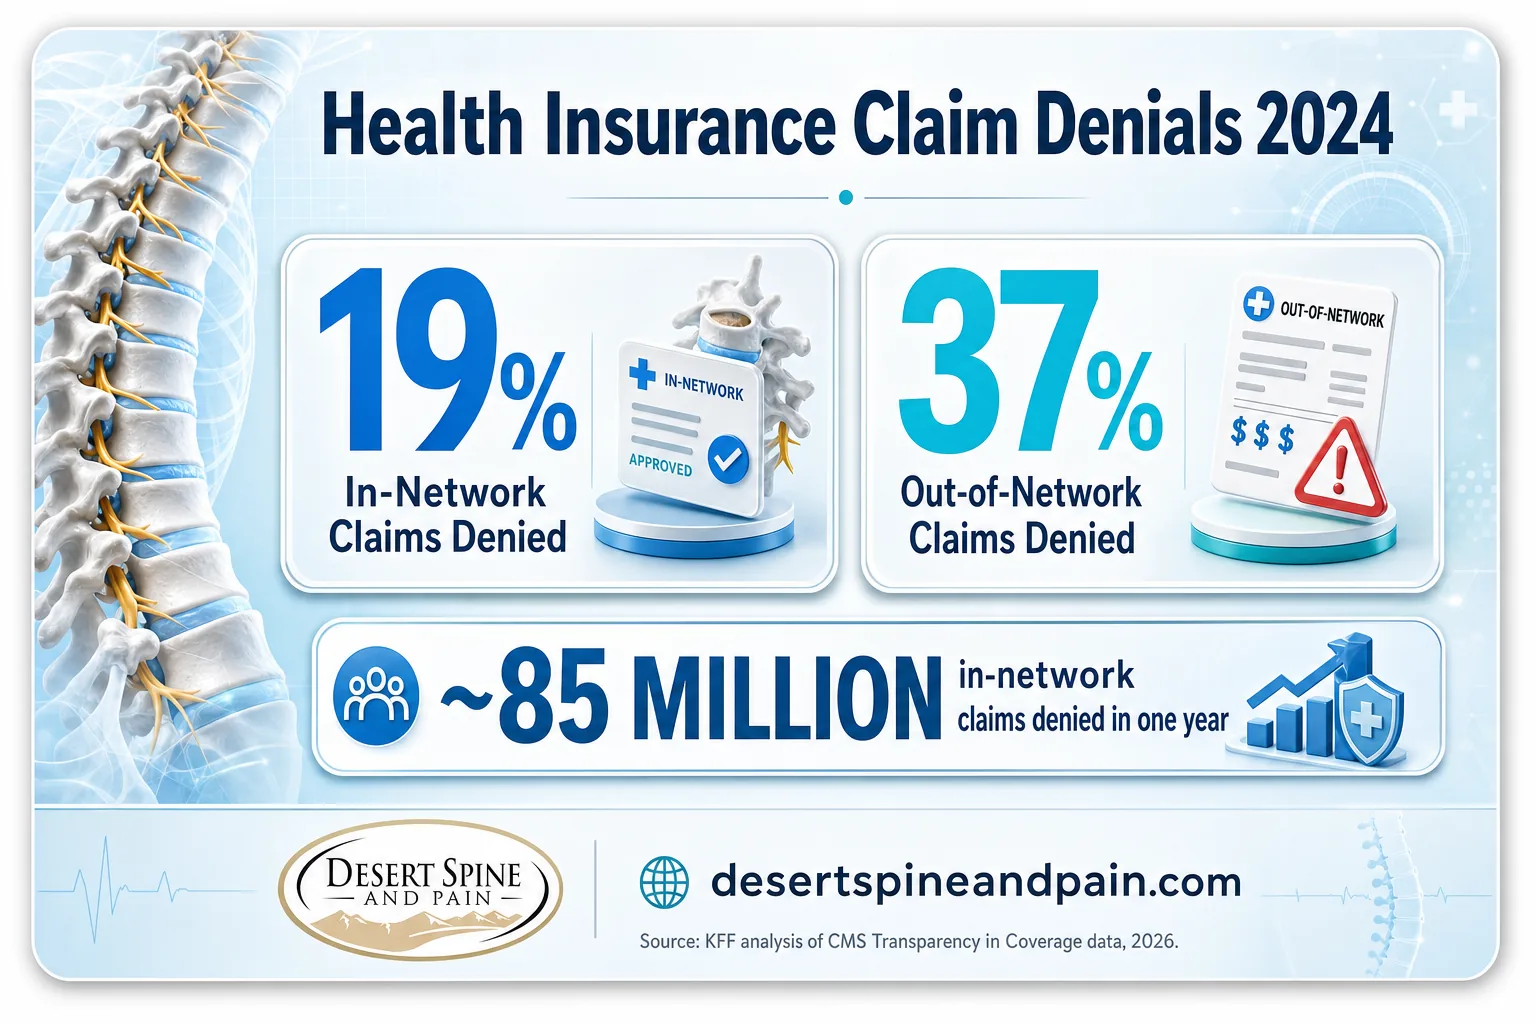
Health insurers selling plans on HealthCare.gov denied 19% of in-network claims and 37% of out-of-network claims in 2024, the most recent federal data show. Yet fewer than 1 in 100 denied claims was ever appealed, even though patients who push back frequently win.
- Insurers on HealthCare.gov denied 19% of in-network claims and 37% of out-of-network claims in 2024, a combined average near 20%, according to KFF's analysis of CMS data (published 2026).
- Denial rates ranged from 3% to 36% across insurers and from 7% (South Dakota) to 27% (Hawaii) across states, so where you live and who you're insured by matters.
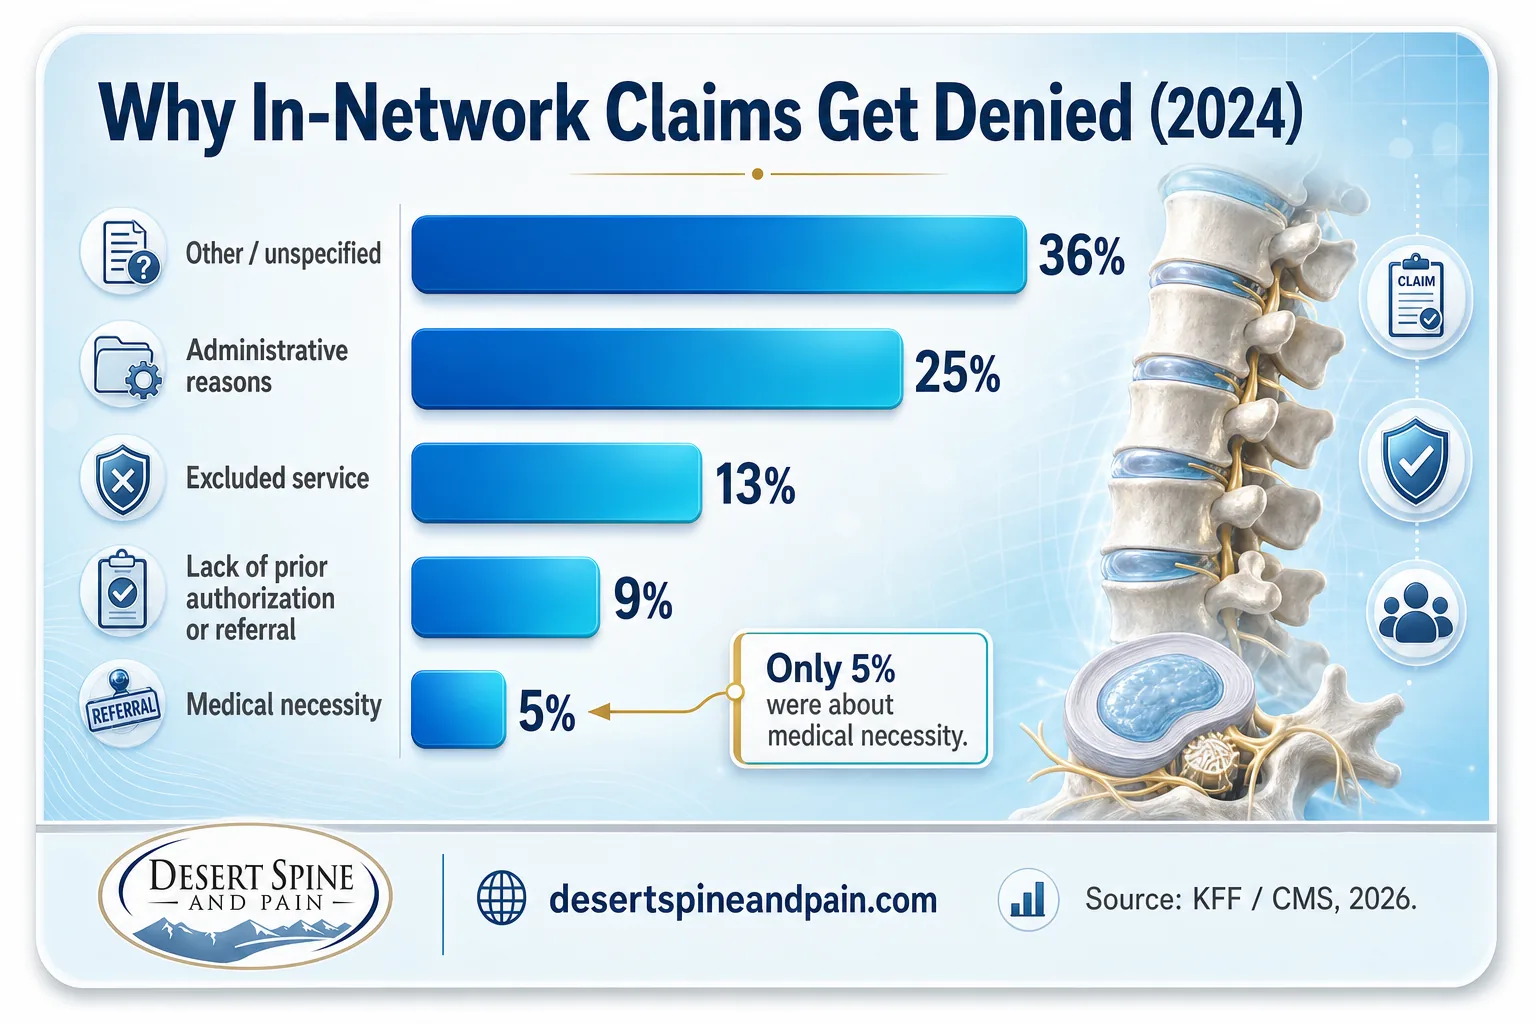
- Only 5% of in-network denials were based on medical necessity; the largest shares were an unexplained "other" category (36%) and administrative reasons (25%).
- Fewer than 1% of denied claims were appealed in 2024, and the Commonwealth Fund found only about half of patients who faced a denial challenged it.
- Among privately insured adults, 1 in 5 (21%) reported a coverage denial for doctor-recommended care in the past year; 43% of those with a claim denial took on medical debt they're still paying.
- When patients do appeal, results are meaningful: about one-third of claim-denial challenges reduced or erased the bill, and most Medicare Advantage denials are overturned when pursued.
What's in This Report
1The National Denial Rate: How Often Claims Are Rejected
Every year, insurers reject a large and remarkably consistent slice of the claims they receive. In 2024, insurers offering qualified health plans on HealthCare.gov received about 496 million claims, roughly 91% of them for in-network services. Of the in-network claims, approximately 85 million were ultimately denied, an average in-network denial rate of 19%. Out-of-network claims were denied at nearly twice that rate.
Averages hide enormous variation. Individual insurer denial rates ranged from 3% to 36%, and the differences by state were just as stark. The state with the highest average in-network denial rate was Hawaii at 27%, while South Dakota had the lowest at 7%. Even within a single state the spread can be wide: insurers in Texas ranged from 12% to 36%, the highest single insurer-level rate in the country.
Average In-Network Denial Rate by State, Selected (2024)
Source: KFF analysis of CMS Transparency in Coverage data, 2026. In-network claims, HealthCare.gov insurers.
For perspective across market segments, a national summary from the National Association of Insurance Commissioners (NAIC) put the average claims denial rate for combined in- and out-of-network claims, excluding pharmacy, at 16% in 2024. Government programs show their own patterns: KFF found Medicare Advantage plans denied nearly 8% of prior authorization requests in 2024, while traditional Medicare denied about 23% of the limited set of requests subject to prior authorization.
Source: KFF | NAIC MCAS Dashboard
Explore least-invasive-first treatment options2Why Claims Get Denied: The Reason Breakdown
When insurers report why they denied a claim, the answers are often uninformative. In the 2024 HealthCare.gov data, the single largest category of in-network denial reasons was an unspecified "other" bucket, at 36%. Administrative reasons, which include duplicate claims, missing information, and untimely filing, accounted for another 25%. Together, more than half of all denials came down to reasons that tell patients almost nothing about whether the care itself was appropriate.
| Denial Reason | Share of In-Network Denials (2024) |
|---|---|
| Other (unspecified) | 36% |
| Administrative reasons | 25% |
| Excluded service | 13% |
| Lack of prior authorization or referral | 9% |
| Medical necessity | 5% |
The variation between insurers is dramatic. While medical necessity accounted for just 5% of denials overall, some plans reported far higher shares. And while lack of prior authorization or referral made up 9% of denials nationally, one Arizona plan reported that 97% of its denial reasons were tied to missing prior authorization or referral, a reminder that a single missing form can be the difference between a paid and an unpaid claim.
The data says otherwise. Only 5% of in-network denials in 2024 were based on medical necessity. The overwhelming majority were administrative, unexplained, or tied to coverage rules and paperwork. A denial is frequently a statement about process, not about whether you need the care your doctor recommended.
Source: KFF analysis of CMS Transparency in Coverage data
See our interventional pain treatments3The Appeals Gap: Why Patients Don't Fight Back
The most striking number in the entire dataset may be how rarely denials are challenged. Of the roughly 85 million in-network claims denied by HealthCare.gov insurers in 2024, consumers appealed at least 262,982, an appeal rate of less than 1%. When patients did appeal internally, insurers upheld their original decision 66% of the time. External appeals to an independent third party were rarer still, with at least 5,881 filed in 2024.
Why do so few people push back? The Commonwealth Fund's 2025 Affordability Survey found that patients often did not know they had the right to appeal, doubted an appeal would change anything, or were confused about who to contact. A separate KFF finding underscored the knowledge gap: only 40% of consumers believed they had a legal right to an external appeal, while 51% were unsure and 9% believed they had no such right.
Combining two federal-grade sources shows the size of the gap. KFF/CMS data put denied in-network HealthCare.gov claims at roughly 85 million in 2024, with fewer than 1% appealed. The Commonwealth Fund found that among patients who did challenge a claim denial, about one-third had the amount owed reduced or eliminated. If even a fraction of the unappealed claims followed that same one-third success pattern, the number of reversible denials left unchallenged runs into the millions. Calculation and interpretation original to Desert Spine and Pain, based on KFF (2026) and Commonwealth Fund (2026) data.
Source: KFF | Commonwealth Fund
Read patient experiences4What Denials Cost Patients: Debt, Delay, and Distress
Behind the percentages are real financial and health consequences. The Commonwealth Fund's 2025 survey of privately insured adults found that 1 in 5 (21%) reported a coverage denial for doctor-recommended care in the past year, either before care (a prior authorization denial) or after (a claim denial). The fallout was significant.
The damage isn't only financial. Among people who experienced a prior authorization denial, about 40% said it delayed their care and more than a quarter (28%) said a health problem got worse as a result. More than 60% said the denial caused worry and anxiety. For patients with a claim denial, 30% reported a delay in care and 1 in 5 said their health problem worsened. More than half of those who took on debt said the original bill was $1,000 or more.
Consequences Reported After a Coverage Denial
Source: Commonwealth Fund 2025 Affordability Survey, published 2026.These findings matter especially for people dealing with spine and nerve conditions, where a delay in diagnosis or treatment can allow a problem to progress. For patients weighing whether to accept a denial or seek care anyway, the numbers make the case for not giving up quietly.
Source: Commonwealth Fund 2025 Affordability Survey
Book a consultation: (602) 566-95005Out-of-Network Denials and Spine Care
Out-of-network claims are denied at nearly double the in-network rate, 37% versus 19% in 2024. For patients seeking a specific spine surgeon or a minimally invasive technique not offered inside their network, that gap can feel like a locked door. It usually isn't. Many PPO and POS plans still reimburse a portion of out-of-network care after the deductible, and denials for out-of-network status are often about plan design rather than whether the care was needed.
Dr. David L. Greenwald, MD, FACS, leads Desert Spine and Pain as both a spine surgeon and a neurosurgeon, and the practice works with patients across the network spectrum, including those with out-of-network coverage. The administrative team verifies benefits, explains costs up front, and assists with the paperwork for reimbursement or appeal, so patients can focus on their health while the practice handles the insurance side. For patients who arrive through a personal injury attorney, the practice coordinates documentation directly with legal teams.
Read the denial letter for the stated reason and deadline. Because only about 5% of denials are truly about medical necessity, many are fixable, a corrected code, a missing prior authorization, or a resubmission. You have the right to an internal appeal, and often an external one. And an out-of-network denial does not mean you cannot receive the care; it means the coverage math is different. Ask your provider's billing team to verify benefits before assuming a treatment is out of reach. This article is general information, not medical or financial advice; consult a qualified professional about your specific situation.
For a deeper look at how partial reimbursement and benefit verification work when you choose a specialist outside your plan's network, see our guide to choosing an out-of-network spine surgeon.
Source: KFF | Commonwealth Fund
Explore our spine surgery optionsHealth Insurance Claim Denial Statistics: Summary Table (2026)
| Statistic | Figure | Source | Year |
|---|---|---|---|
| In-network claim denial rate, HealthCare.gov | 19% | KFF / CMS | 2024 |
| Out-of-network claim denial rate | 37% | KFF / CMS | 2024 |
| Combined average denial rate | ~20% | KFF / CMS | 2024 |
| In-network claims denied (volume) | ~85 million | KFF / CMS | 2024 |
| Range of denial rates by insurer | 3%–36% | KFF / CMS | 2024 |
| Highest state average (Hawaii) | 27% | KFF / CMS | 2024 |
| Lowest state average (South Dakota) | 7% | KFF / CMS | 2024 |
| Denials in "other" (unspecified) category | 36% | KFF / CMS | 2024 |
| Denials for administrative reasons | 25% | KFF / CMS | 2024 |
| Denials for excluded service | 13% | KFF / CMS | 2024 |
| Denials for lack of prior auth or referral | 9% | KFF / CMS | 2024 |
| Denials for medical necessity | 5% | KFF / CMS | 2024 |
| Share of denied claims appealed | <1% | KFF / CMS | 2024 |
| Internal appeals upheld by insurer | 66% | KFF / CMS | 2024 |
| NAIC average denial rate (in + out, excl. pharmacy) | 16% | NAIC MCAS | 2024 |
| Privately insured adults reporting a denial | 21% | Commonwealth Fund | 2025 |
| Claim-denial patients who paid more money | ~70% | Commonwealth Fund | 2025 |
| Claim-denial patients now carrying medical debt | 43% | Commonwealth Fund | 2025 |
| Claim-denial challenges that reduced/erased the bill | 33% | Commonwealth Fund | 2025 |
| Medicare Advantage prior auth denial rate | ~8% | KFF | 2024 |
Frequently Asked Questions
What percentage of health insurance claims are denied?
How often are denied claims overturned on appeal?
Why do insurance companies deny claims?
Do most people appeal a denied health insurance claim?
Can I still see an out-of-network spine surgeon if my insurer denies coverage?
Methodology & Sources
How we compiled this report
All figures are drawn from Tier 1 primary sources: federal agencies, nonpartisan research organizations, and insurance regulators. National denial rates, reason breakdowns, and appeals data come from KFF's analysis of the CMS Transparency in Coverage 2026 Public Use File, which covers plan-year 2024 claims for qualified health plans sold on HealthCare.gov. Patient-experience figures come from the Commonwealth Fund's 2025 Health Care Affordability Survey (published June 2026), a nationally representative survey of 6,353 adults, with analysis focused on 4,589 privately insured respondents. Cross-market context comes from the National Association of Insurance Commissioners' Market Conduct Annual Statement dashboard.
Denial-reason percentages reflect reported denial reasons and may include more than one reason per claim, per CMS reporting structure. Figures are rounded. Where data reflect only HealthCare.gov qualified health plans, they may not represent employer-sponsored or self-funded plans, which cover most insured people under 65.
- KFF, "Claims Denials and Appeals in ACA Marketplace Plans in 2024" (2026)
- Commonwealth Fund, "How Health Insurance Coverage Denials Affect Americans: 2025 Affordability Survey" (2026)
- Centers for Medicare & Medicaid Services (CMS), Transparency in Coverage Public Use File (2026)
- National Association of Insurance Commissioners (NAIC), Market Conduct Annual Statement Dashboard (2024)
You are welcome to cite these statistics with attribution to the original primary sources named above (KFF, Commonwealth Fund, CMS, NAIC). When referencing the Desert Spine and Pain Analysis, please attribute the calculation to Desert Spine and Pain. This article is general information and not medical or financial advice.