

Spine Surgery Success Rate Statistics (2026): What the Data Really Shows
Spine surgery success rates are consistently high, but the headline number hides a bigger truth: a 2025 review found reported success spanning 60 to 95 percent, and one systematic review documented spinal fusion satisfaction reported as low as 16 percent and as high as 95 percent. The single biggest reason for that spread is how each study defines "success" in the first place.
- A 2025 review found spine surgery success rates ranging from 60 to 95 percent across fusion, discectomy, decompression, and deformity correction, driven mainly by differing definitions of success.
- A systematic review documented spinal fusion satisfaction reported from a low of 16 percent to a high of 95 percent, with an average of about 68 percent reporting a successful outcome.
- Pooled data puts spinal fusion satisfaction near 71 percent with a reoperation rate around 3.9 percent and mortality of 0.105 to 0.321 percent.
- Artificial disc replacement reports 85 to 95 percent success and 75.5 to 93.3 percent satisfaction, with cervical disc replacement at 81 percent success at 10 years versus 66 percent for fusion.
- In a 486-patient prospective cohort, 80.7 percent were satisfied and 59.6 percent met a strict combined success definition.
- Predictors of success include accurate diagnosis, patient selection, baseline psychological health, realistic expectations, and avoiding preoperative opioid dependence.
- The number that matters is not the population average, it is your individual likelihood of benefit, which only a careful evaluation can estimate.
What's in This Guide
1Why "Success Rate" Depends on the Definition
Before any success percentage means anything, you have to ask what was measured. A surgeon might call a fusion successful because the vertebrae fused solidly on a CT scan. A patient might call the same operation a failure because their pain persists. Both are using the word "success," and they are measuring completely different things.
A 2025 systematic review in the Journal of Neurosurgery: Spine analyzed 20 studies covering 1,324 spinal fusion procedures and found that patient satisfaction rates ranged from as low as 16 percent to as high as 95 percent. The authors concluded that a major source of this discrepancy is the difference in how clinicians evaluate fusion, whether by imaging, symptom relief, or patient-reported satisfaction.
Not quite. A population success rate blends together different patients, different surgeons, and different definitions of success. It tells you how the procedure performs on average, not how it will perform for your specific anatomy, diagnosis, and health. A well-selected patient with a clear surgical target may have a far higher likelihood of benefit than the average implies, and a poorly-selected one far lower. The average is a starting point for a conversation, not a personal prediction.
This is why our Phoenix practice, led by board-certified neurosurgeon and spine surgeon Dr. David L. Greenwald, MD, FACS, treats diagnosis and patient selection as the most important part of surgical planning. The right operation on the right patient is what turns a population statistic into a personal result.
Explore spine surgery options in PhoenixSource: Journal of Neurosurgery: Spine, 2025 | Journal of Spine Surgery review, 2025
2Success Rates by Procedure
With the definition caveat in mind, here is how the most common spine procedures perform in the peer-reviewed literature. These figures describe appropriately selected patients and describe averages, not guarantees.
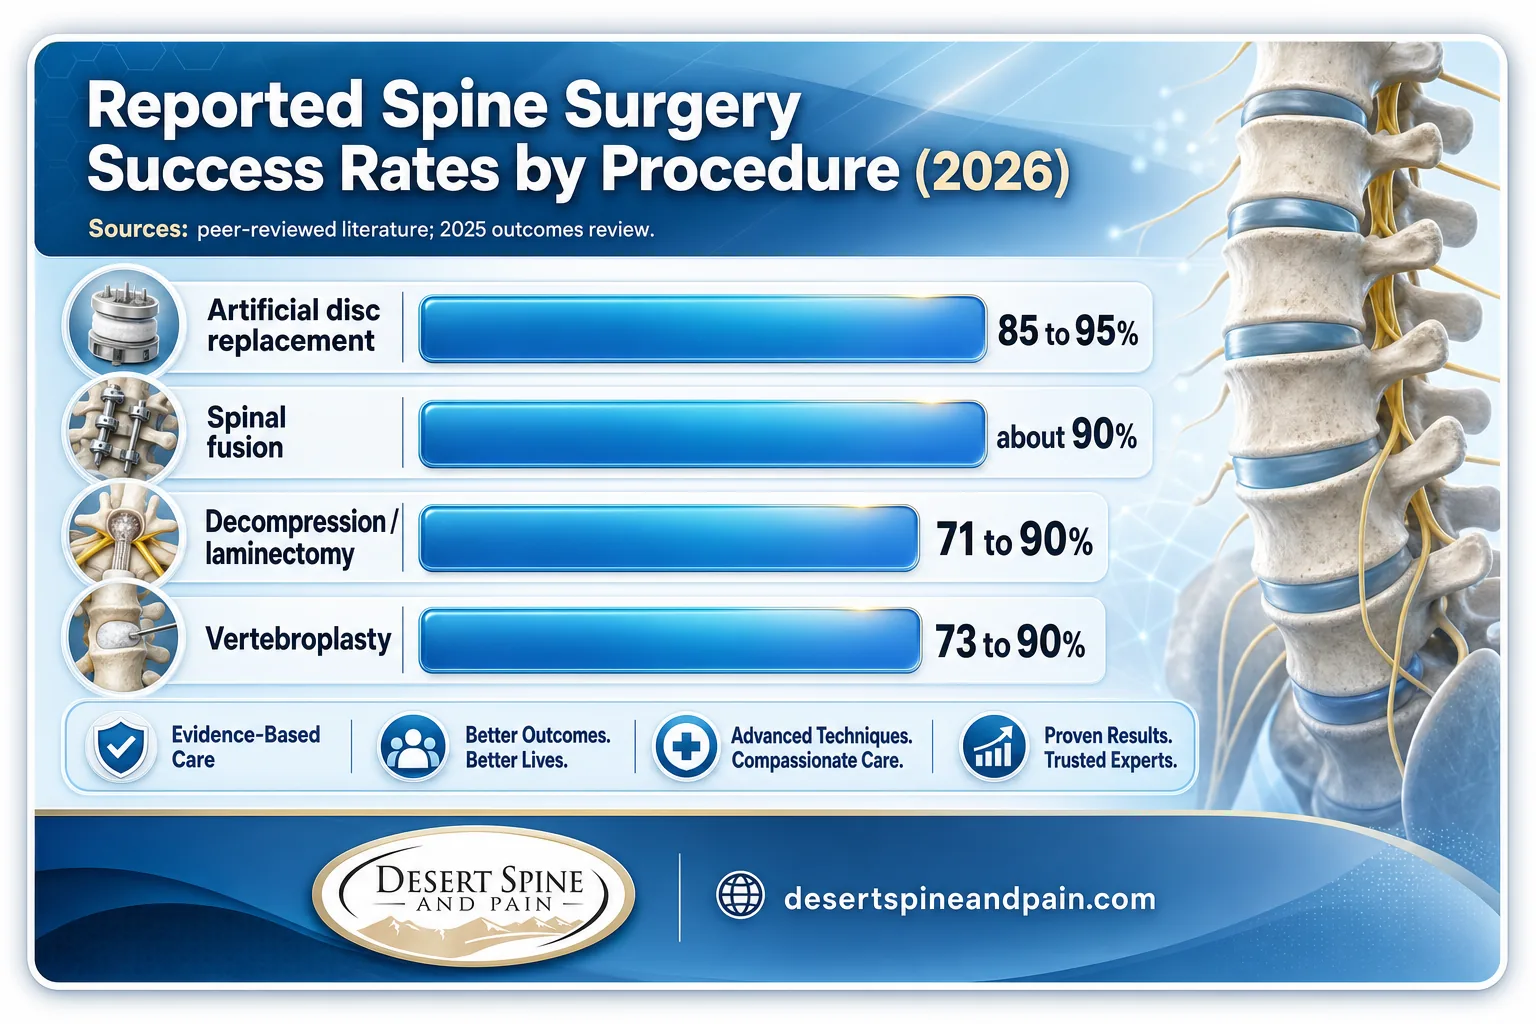
The disc replacement figures are worth highlighting. A long-term comparison found cervical disc replacement reached 81 percent overall success at 10 years compared with 66 percent for fusion, and lumbar disc replacement studies report satisfaction between 75.5 and 93.3 percent. Motion preservation is not right for every patient, but for the right candidate the durability data is compelling.
Dr. Greenwald's dual training as both a spine surgeon and a neurosurgeon means he evaluates candidates across the full menu of these procedures, including motion-preservation options, rather than defaulting to one technique.
Source: Spine Together (peer-reviewed compilation) | 2025 outcomes review summary
3Patient Satisfaction vs Clinical Success
One of the most important findings in recent spine research is that clinical improvement and patient satisfaction do not always match. A patient can improve measurably on disability and pain scales yet still feel dissatisfied, and understanding why is central to defining success honestly.
The 486-patient cohort is instructive. When success was defined only as satisfaction, 80.7 percent qualified. When success required both satisfaction and objective pain and disability thresholds, that figure dropped to 59.6 percent. Same patients, same surgeries, very different "success rate," depending entirely on the yardstick.
| Success Category (486-patient cohort) | Share of Patients | Definition |
|---|---|---|
| Success | 59.6% | Satisfied AND pain/disability below cutoff |
| Incomplete success | 20.4% | Satisfied, thresholds not fully met |
| Incomplete failure | 7.1% | Unsatisfied, thresholds not fully met |
| Failure | 12.4% | Unsatisfied AND poor pain/disability |
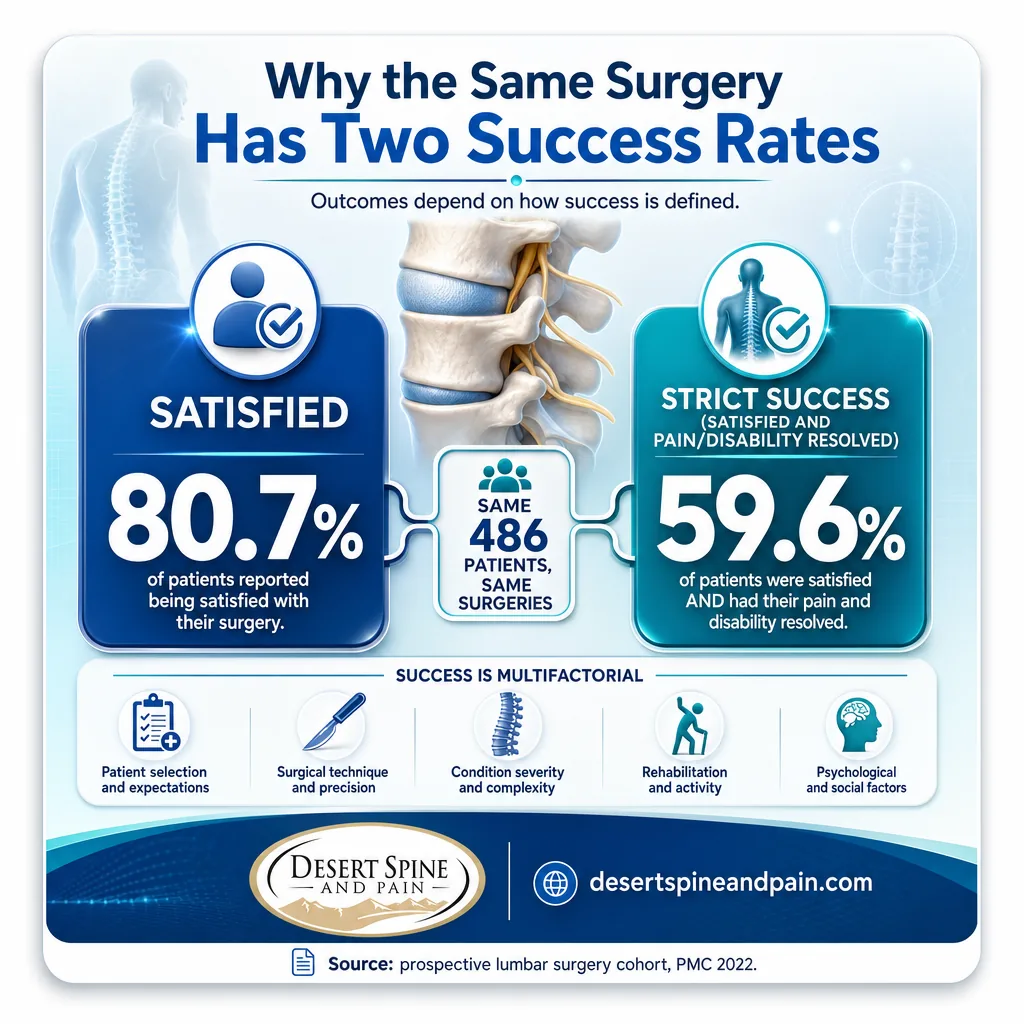
Combining the JNS Spine systematic review (fusion satisfaction from 16 to 95 percent) with the 486-patient cohort (satisfaction 80.7 percent, strict success 59.6 percent) reveals a roughly 20-point gap between "satisfied" and "objectively successful" even within a single high-quality study. The lesson for patients: ask your surgeon which definition their quoted success rate uses, and ask what their result looks like under the strictest definition. Calculation and interpretation original to Desert Spine and Pain.
Source: Prospective lumbar surgery cohort, PMC 2022 | Spine Journal satisfaction analysis
4What Predicts a Successful Outcome
If success rates vary this much, the natural question is what tips a patient toward the good end of the range. The research points to factors that are, encouragingly, largely identifiable before surgery.
The pattern is clear: outcomes are shaped as much by preoperative factors as by the operation itself. Accurate diagnosis, appropriate patient selection, realistic expectations, addressing preoperative opioid use, and attention to psychological readiness all move the needle. Emerging evidence on prehabilitation, preparing the body before elective surgery, points in the same direction.
Many of these predictors are things a careful surgeon evaluates and acts on before ever entering the operating room. Choosing not to operate on a poor candidate, or recommending a less invasive option, directly improves the success statistics for everyone who does proceed. Dr. Greenwald's least-invasive-first philosophy and dual spine-and-neurosurgery training are built around exactly this kind of selection.
Source: Spine Journal predictors analysis | International Journal of Spine Surgery, 2025
5Surgery vs Non-Surgical Treatment
A success rate only matters relative to the alternative. For some conditions, surgery clearly outperforms continued conservative care; for others, the evidence is mixed, which is exactly why the diagnosis drives the decision.
The NFL data is a useful illustration because it tracks a high-demand population objectively. Lumbar procedures allowed most players to return and even improve, while cervical procedures were tougher to come back from, a reminder that success is procedure-specific and location-specific, not a single number.
For the general patient, the literature supports surgery over non-operative care when there is clear nerve compression from a herniated disc or stenosis, while cautioning that some degenerative back pain shows no clear surgical advantage. Matching the patient to the evidence is the whole game.
Desert Spine and Pain works with out-of-network patients of every kind and partners closely with personal injury attorneys, providing 24/7 concierge response and coordination for injured clients whose recovery and case outcomes both depend on the right surgical decision.
Review the conditions we treatSource: NFL spine surgery outcomes study, PMC 2025
Summary Table: Success Rate Statistics 2026
| Statistic | Figure | Source | Year |
|---|---|---|---|
| Overall spine surgery success range | 60 to 95% | 2025 outcomes review | 2025 |
| Fusion satisfaction range (definition-driven) | 16 to 95% | JNS Spine systematic review | 2025 |
| Average fusion "successful outcome" | ~68% | JNS Spine systematic review | 2025 |
| Spinal fusion success (pooled) | ~90% | Peer-reviewed compilation | 2026 |
| Spinal fusion satisfaction (pooled) | 71.1% | Peer-reviewed compilation | 2026 |
| Spinal fusion reoperation rate | 3.9% | Peer-reviewed compilation | 2026 |
| Spinal fusion mortality | 0.105 to 0.321% | Peer-reviewed compilation | 2026 |
| Decompression / laminectomy success | 71 to 90% | Peer-reviewed compilation | 2026 |
| Artificial disc replacement success | 85 to 95% | Peer-reviewed compilation | 2026 |
| Disc replacement satisfaction | 75.5 to 93.3% | Peer-reviewed compilation | 2026 |
| Cervical disc replacement success at 10 yrs | 81% | 2025 outcomes review | 2025 |
| Cervical fusion success at 10 yrs | 66% | 2025 outcomes review | 2025 |
| Satisfied (486-patient cohort) | 80.7% | PMC prospective cohort | 2022 |
| Strict success (486-patient cohort) | 59.6% | PMC prospective cohort | 2022 |
| General satisfaction range | 53 to 90% | Spine Journal analysis | 2020 |
| Lumbar surgery return-to-play (NFL) | 61% | PMC NFL study | 2025 |
| Cervical surgery return-to-play (NFL) | 47% | PMC NFL study | 2025 |
Frequently Asked Questions
What is the success rate of spine surgery?
Why do reported spine surgery success rates vary so much?
What is the patient satisfaction rate after spinal fusion?
What factors predict a successful spine surgery?
Is spine surgery more successful than non-surgical treatment?
Methodology & Sources
How we compiled these statistics
Every figure traces to a Tier 1 primary source: peer-reviewed systematic reviews, prospective cohorts, and journal analyses. Success and satisfaction ranges reflect appropriately selected patients and describe populations, not any individual. Where studies disagree, we note that the difference usually reflects how success was defined rather than a difference in surgical quality.
Primary sources referenced:
- Journal of Neurosurgery: Spine, systematic review defining successful spinal fusion, 2025
- Prospective lumbar surgery success and failure cohort (486 patients), PMC, 2022
- International Journal of Spine Surgery, lumbar fusion satisfaction study, 2025
- The Spine Journal / ScienceDirect, patient satisfaction and predictors analyses
- NFL cervical and lumbar spine surgery outcomes study, PMC, 2025
- Journal of Spine Surgery outcomes review (2015 to 2025 literature), 2025
- Peer-reviewed success-rate literature compiled with citations by Spine Together, 2026
This article is educational and is not individual medical advice. For guidance specific to your spine condition, consult a qualified spine surgeon. No outcome can be guaranteed.
Journalists and researchers may cite these statistics with attribution to Desert Spine and Pain and a link to this page. Please attribute the underlying figures to their original Tier 1 sources as listed above. For expert commentary on spine surgery outcomes from a board-certified neurosurgeon and spine surgeon, contact Desert Spine and Pain at (602) 566-9500.



