

Pain Relief Industry Statistics (2026): OTC, Topical, and Product Market Data
The pain relief product market is enormous and growing, with global over-the-counter analgesics estimated near $31 billion in 2026 and the topical segment expanding almost twice as fast as pills. Behind those sales is a story about self-medication: most people manage minor pain on their own, but heavy long-term use of common pain relievers carries real risks. Here is what the 2026 data says about the pain relief industry, and what it means when pain does not go away.
Key Takeaways
- Global OTC analgesics are estimated at ~$29B to $31B in 2026, growing around 3.9% to 4.3% CAGR.
- Topical pain relief is the fastest-growing format, advancing at roughly 8% to 8.7% CAGR, nearly double oral products.
- Non-opioid products dominate: non-opioid topicals hold about 63% of global volume as the market shifts away from opioids.
- Self-medication is the norm: over 60% of people prefer OTC drugs for mild-to-moderate issues (WHO, cited).
- OTC drugs save an estimated $102 billion a year in U.S. healthcare costs, mostly by avoiding visits.
- But there are real risks: chronic NSAID use is linked to up to 30% higher cardiovascular risk and ~100,000 U.S. GI-bleed hospitalizations yearly.
- Products treat symptoms, not causes: persistent spine pain needs a diagnosis, not just a stronger cream.
What's in This Guide
01 The Size of the Pain Relief Product Market
Pain relief products, the pills, gels, patches, and sprays people buy to manage pain, form one of the largest consumer-health categories in the world.
Estimates vary by firm and scope. The global over-the-counter analgesics market is estimated between about $29.44 billion and $31.37 billion in 2026, growing at roughly 3.9% to 4.3% annually. The topical pain relief segment specifically is estimated around $12.39 billion to $13.18 billion globally. Broader "analgesics" market reports that fold in prescription products land in different ranges again, near $23 billion to $24 billion by some estimates, because they define the category differently. North America consistently holds the largest regional share, around 38%.
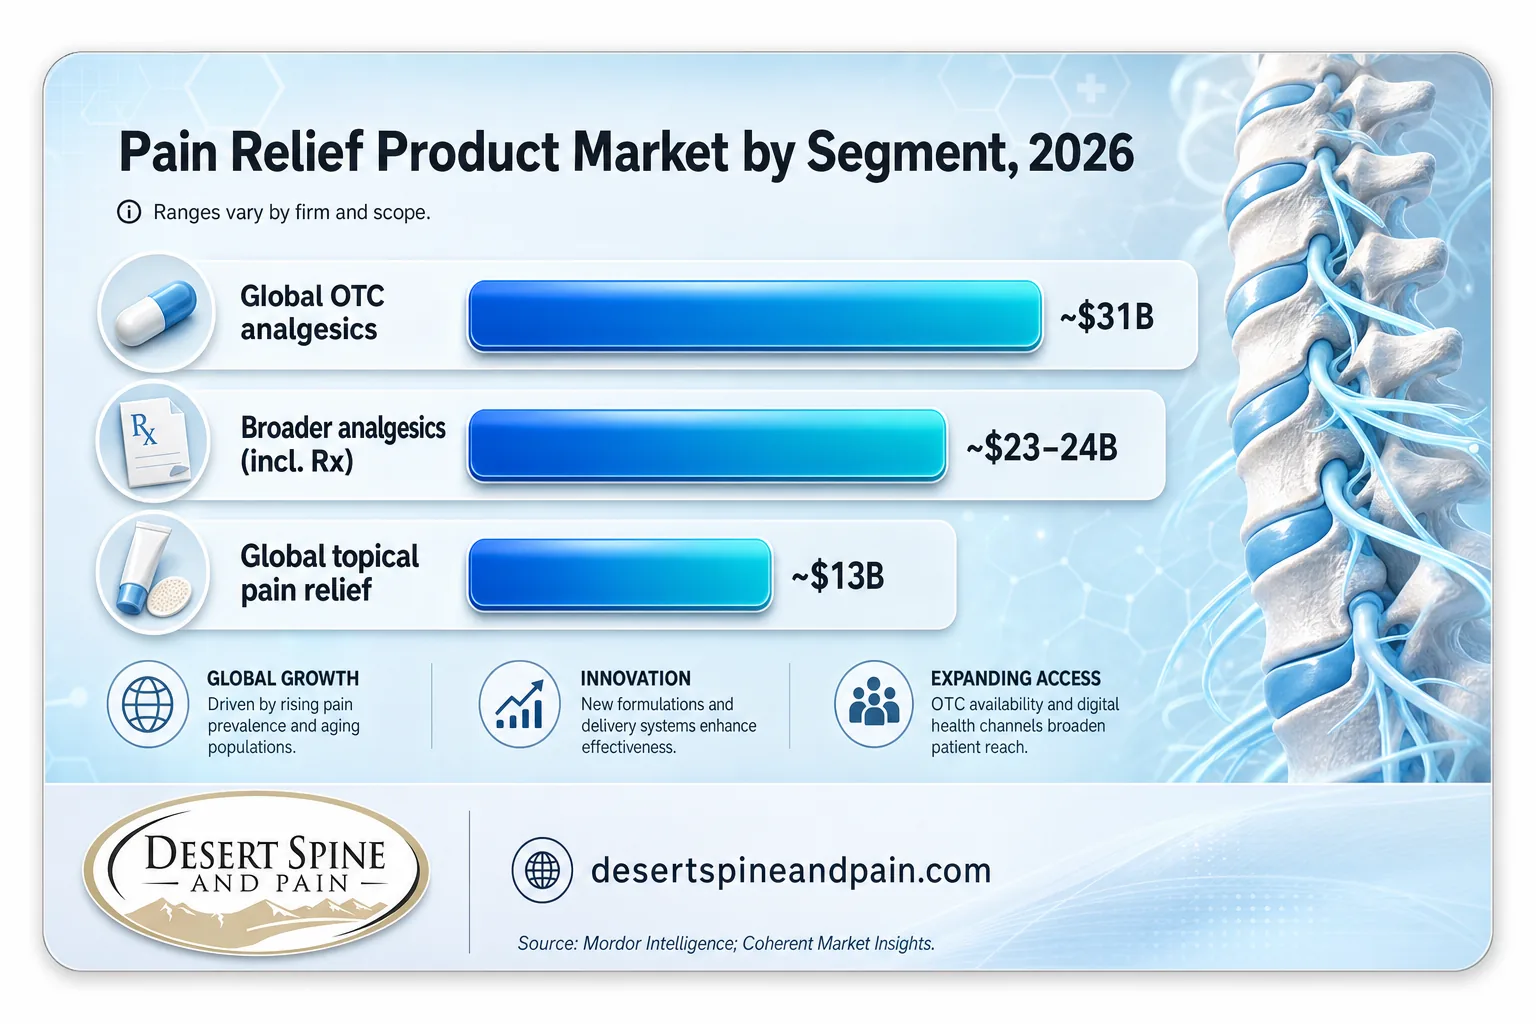
Reading pain relief market figures carefully
"Pain relief market" can mean very different things: OTC analgesics only, topical products only, or all analgesics including prescriptions. Figures in this article range from about $12 billion (topical) to $31 billion (OTC) because each measures a different slice. Always check what a given number includes before comparing. Ranges are presented here so no single estimate is treated as definitive.
Source: Mordor Intelligence, OTC analgesics market | Mordor Intelligence, topical analgesic market
Explore conservative, non-invasive care
02 The Topical Pain Relief Boom
The most dynamic corner of the pain relief market is topical products, applied to the skin rather than swallowed, and the growth reflects a clear consumer preference.
Topical patches, gels, and sprays are advancing at roughly 8% to 8.7% CAGR, close to double the growth rate of oral formats. The shift is driven by a desire for localized relief with fewer systemic side effects: creams and gels together account for about 54% of formulation preference, absorbing within 15 to 30 minutes, while transdermal patches are the fastest-expanding delivery system thanks to extended 8-to-12-hour release. Non-opioid formulations dominate, holding about 63.2% of global topical volume. Notably, regulators on multiple continents now require prescribers to exhaust topical options before starting oral opioids, structurally favoring this segment.
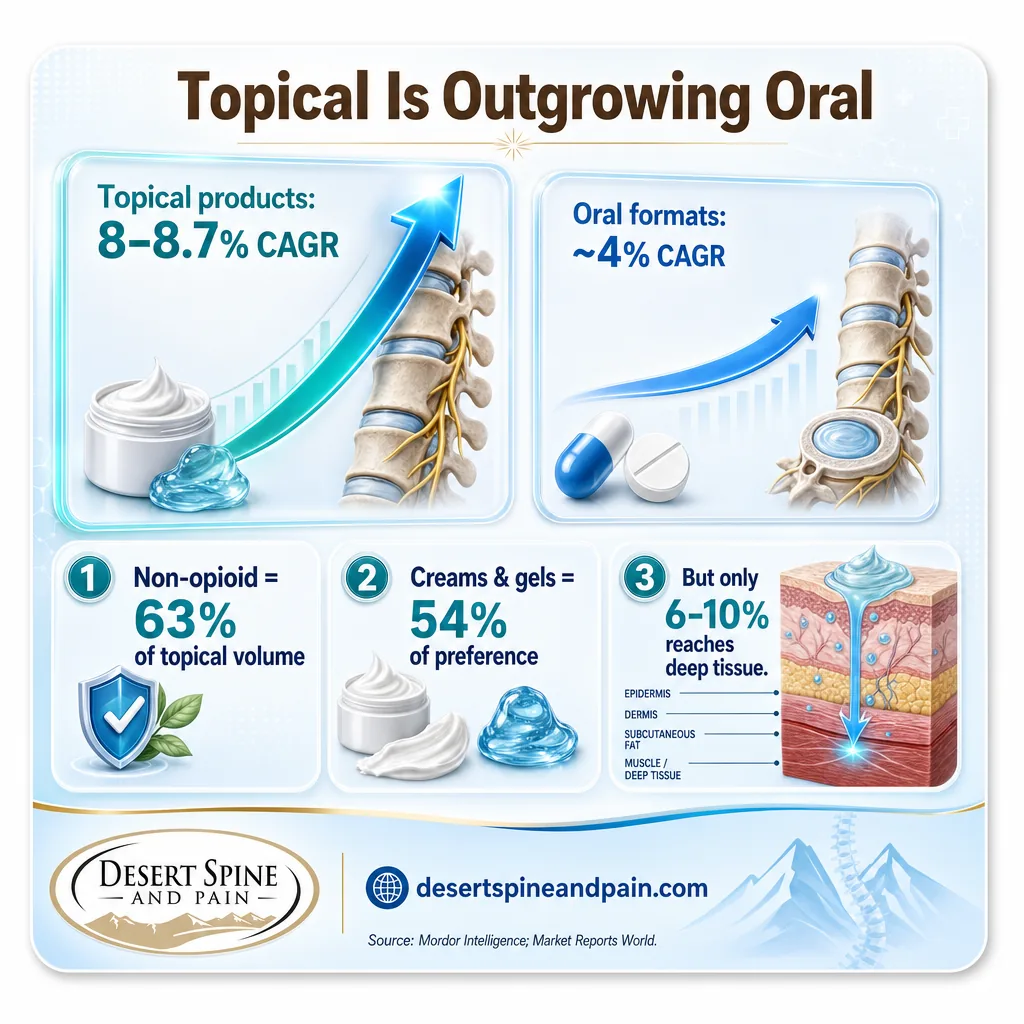
One important limitation the data flags: dermal absorption is modest, only about 6% to 10% of the active drug penetrates deep tissue, which limits topical effectiveness for severe or deep structural pain. In other words, topicals are excellent for localized surface pain but not a substitute for treating a deeper spinal problem.
Source: Mordor Intelligence, topical analgesic segmentation | Topical pain relief market analysis
Learn about medication management
03 Self-Medication and the Non-Opioid Shift
The size of the pain relief market is really a measure of how much pain people manage themselves, without ever seeing a clinician.
World Health Organization data cited in market research indicates that over 60% of the global population prefers self-medication with OTC drugs for mild-to-moderate ailments. That self-care behavior delivers real economic value, OTC medications are estimated to save the U.S. economy about $102 billion annually, with roughly $77 billion of that from avoided clinical visits. At the same time, the entire market is shifting away from opioids: non-opioid product usage has risen sharply, online pharmacy channels are among the fastest-growing distribution routes, and prescription-to-OTC switches continue to expand access to non-opioid options.
Desert Spine and Pain Analysis: The Self-Medication Gap
Combining two data points, over 60% of people self-treating pain with OTC products, against topical drugs penetrating only 6% to 10% into deep tissue, reveals a structural gap in how pain is managed. A large share of people are treating pain with tools designed for surface-level, minor complaints. For genuinely minor aches, that is appropriate and economical. But when the pain source is a disc, joint, or nerve deep in the spine, the very products people reach for first are the least equipped to reach it, which is how treatable conditions go undiagnosed for months.
Formula: 60%+ self-medicate vs. 6-10% deep-tissue penetration of topicals = a gap between how pain is treated and where spine pain originates.
Calculation and interpretation original to Desert Spine and Pain. Source figures: WHO self-medication data and topical dermal-absorption data, both via market research.
Source: Coherent Market Insights, OTC pain medication | Towards Healthcare, OTC analgesics ($102B savings)
See the spine conditions we diagnose and treat
04 The Hidden Cost: Drug-Safety Data
The convenience of pain relief products has a documented downside that the market data does not hide: heavy or prolonged use carries real medical risk.
A 2024 meta-analysis in The Lancet, cited in market research, links long-term NSAID use to up to a 30% higher risk of cardiovascular events, and NSAID-related gastrointestinal bleeding leads to roughly 100,000 U.S. hospitalizations each year at a cost exceeding $2 billion. Opioid-containing products carry their own well-documented dependence risks: a WHO report cited in market analysis found nearly a third of people prescribed opioids for chronic non-cancer pain misused them within a year. These safety concerns are a major reason the entire market is pivoting toward non-opioid and topical options, and a reason that relying on escalating self-medication is not a safe long-term plan.
Myth: "If over-the-counter pain relievers still work, I don't need to see anyone."
Continuing to rely on OTC pain relievers for months can mask a problem that is quietly worsening, and the medications themselves carry cumulative risk with heavy use. Needing steadily more product to control the same pain is a signal, not a solution. Persistent spine or nerve pain deserves an accurate diagnosis, both to protect against medication-related harm and to identify treatments that address the source. This is general information, not individual medical advice.
Source: Mordor Intelligence (Lancet & GI-bleed data) | Coherent Market Insights (WHO opioid data)
Explore targeted interventional pain care
05 What Rising Product Sales Mean for Spine Pain
For anyone with back or neck pain, the pain relief market boom carries a practical lesson: product sales measure symptom management, not problem-solving.
Topical analgesics are used by roughly 43% of chronic pain patients as a first-line or adjunct therapy, and arthritis-related pain drives more than 37% of topical demand. These products have a legitimate role, they relieve symptoms, support function, and reduce reliance on systemic drugs. But they do not diagnose or treat a herniated disc, spinal stenosis, or nerve compression. When pain is persistent, radiating, or worsening, the most valuable step is not a stronger product but an accurate diagnosis.
Where Products Fit in the Least-Invasive-First Ladder
- Self-care and conservative first: OTC and topical products, non-opioid medication, and physical therapy by referral for minor or early pain.
- Interventional pain next: when products are not enough, targeted injections, nerve blocks, and ablation address the source.
- Surgery only when warranted: minimally invasive through complex spine surgery for structural problems that require it.
Desert Spine and Pain is led by Dr. David L. Greenwald, a board-certified surgeon who is both a spine surgeon and a neurosurgeon. The practice helps patients understand when a product is genuinely enough and when persistent pain signals something that deserves a closer look, without jumping past the least-invasive options.
This article summarizes industry and market data and is not financial or medical advice. Market estimates come from independent research firms and vary by methodology. When conservative products stop being enough, targeted options such as spinal injections can address the source of pain directly rather than masking it.
Source: Topical pain relief market (usage data)
See how targeted spinal injections workMeet Dr. Greenwald, spine surgeon and neurosurgeon
06 All the Numbers in One Table
| Statistic | Figure | Source | Year |
|---|---|---|---|
| Global OTC analgesics market | $29.44-31.37B | Coherent / Mordor | 2026 |
| OTC analgesics CAGR | 3.87-4.3% | Mordor / Coherent | 2026-2033 |
| Global topical pain relief market | $12.39-13.18B | Mordor / Market Reports World | 2026 |
| Topical products CAGR | 8-8.72% | Mordor | 2026-2031 |
| Non-opioid share of topical volume | 63.2% | Market Reports World | 2026 |
| Cream/gel format preference | ~54% | Market Reports World | 2026 |
| Deep-tissue penetration of topicals | 6-10% | Market Reports World | 2026 |
| NSAID share of OTC analgesics | 38.61% | Mordor Intelligence | 2025 |
| North America topical market share | 38.11% | Mordor Intelligence | 2025 |
| OTC retail pharmacy channel share | 57.08% | Mordor Intelligence | 2025 |
| Prefer OTC self-medication | 60%+ | WHO (cited) | 2026 |
| Annual U.S. OTC savings | $102B | Towards Healthcare (cited) | 2026 |
| Long-term NSAID CV risk increase | up to 30% | The Lancet (cited) | 2024 |
| U.S. NSAID GI-bleed hospitalizations | ~100,000/yr | Mordor (cited) | 2026 |
| Cost of GI-bleed hospitalizations | $2B+ | Mordor (cited) | 2026 |
| Opioid misuse within a year of Rx | ~33% | WHO 2021 (cited) | 2026 |
| Chronic pain patients using topicals | ~43% | Market Reports World | 2026 |
| U.S. topical market CAGR | 8.6% | Expert Market Research | 2026-2035 |
07 Frequently Asked Questions
How big is the pain relief product market in 2026?
What is the fastest-growing pain relief product segment?
How common is self-medication for pain?
Are over-the-counter pain relievers safe for long-term use?
Why does the pain relief product boom matter for back pain?
Methodology & Sources
Market-size and growth figures come from independent market-research firms including Mordor Intelligence, Coherent Market Insights, Towards Healthcare, Market Reports World, and Expert Market Research. Because these firms define the "pain relief" market differently (OTC analgesics, topical products, or all analgesics including prescriptions), estimates vary and are presented as ranges. Drug-safety figures cited within those reports trace to peer-reviewed and institutional sources, including a 2024 meta-analysis in The Lancet (NSAID cardiovascular risk), World Health Organization data (self-medication and opioid misuse), and U.S. hospitalization cost estimates.
Market-research estimates are proprietary projections, not measured government statistics, and should be read as informed forecasts. Drug-safety statistics are presented for general education and are not a substitute for guidance from a physician or pharmacist. This article is not financial, investment, or medical advice.
Media & press: Journalists and researchers may cite these statistics with attribution to Desert Spine and Pain and a link to this page. The Desert Spine and Pain Analysis box contains original calculation and interpretation.
Talk to a Phoenix Spine and Pain Specialist
Desert Spine and Pain is led by Dr. David L. Greenwald, MD, FACS, a board-certified surgeon who is both a spine surgeon and a neurosurgeon. The practice serves out-of-network patients across Greater Phoenix and partners with personal injury attorneys, offering 24/7 concierge response for their clients. Care follows a least-invasive-first philosophy, from conservative treatment through interventional pain management to complex spine surgery.
Call (602) 566-9500 to book a consultation.



