

Pain Management Industry Statistics (2026): Market Size, Growth, and Access Data
The pain management industry is large and growing steadily, with the U.S. market estimated near $32 billion in 2026 and global estimates ranging from roughly $80 billion to $85 billion. Growth is driven by an aging population, a shift away from opioid-first care, and rising demand for interventional procedures, even as provider shortages leave many patients waiting. Here is what the 2026 data says about the size, growth, and access dynamics of pain management.
Key Takeaways
- The U.S. pain management market is estimated at $32.31 billion in 2026, up from $31.18 billion in 2025.
- Global estimates range from ~$80B to $85B in 2026, varying by research firm and market scope.
- Growth runs 3.6% to 4.7% CAGR, reaching a projected $42.87 billion (U.S.) by 2034 and $96B+ globally by 2030.
- Aging and opioid-alternative demand are the top drivers, alongside rising surgical volumes.
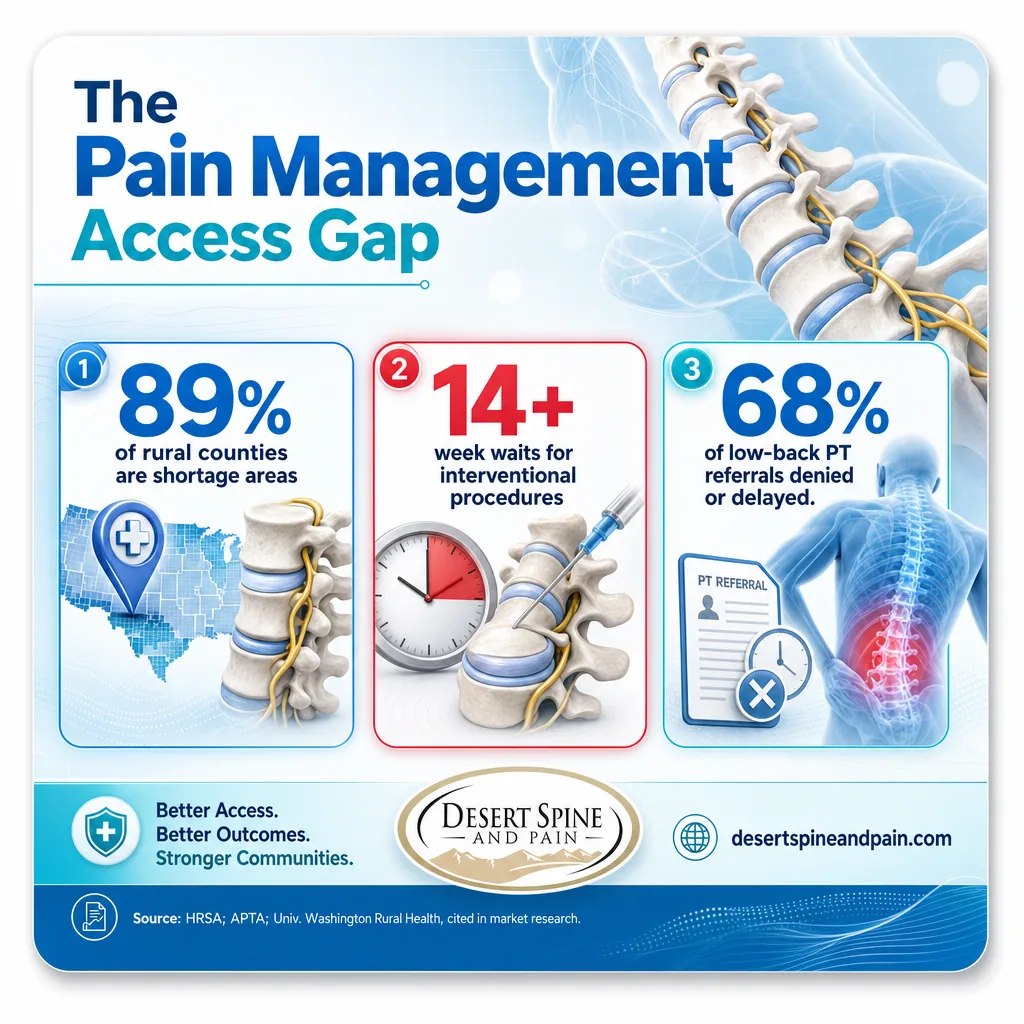
- Provider shortage is real: 89% of rural counties are designated pain-management shortage areas, with 14+ week waits for interventional procedures.
- Outpatient shift: ambulatory settings deliver interventional procedures at 30% to 50% lower facility cost.
- Access barriers persist: 68% of initial physical therapy referrals for low back pain are denied or delayed, per APTA data cited in market research.
What's in This Guide
01 Market Size in 2026
The pain management industry spans medication, interventional procedures, devices, physical therapy, and behavioral care. Its total size depends heavily on which of those segments a given report includes, which is why estimates vary.
The U.S. pain management market was valued at about $31.18 billion in 2025 and is estimated at $32.31 billion in 2026. Global figures differ by source: several firms place the 2026 global market between roughly $80 billion and $85 billion, with North America holding the largest regional share at about 38%. These differences reflect scope, some reports count only drugs and devices, others include services and therapy, rather than disagreement about the underlying trend, which is consistent, steady growth.
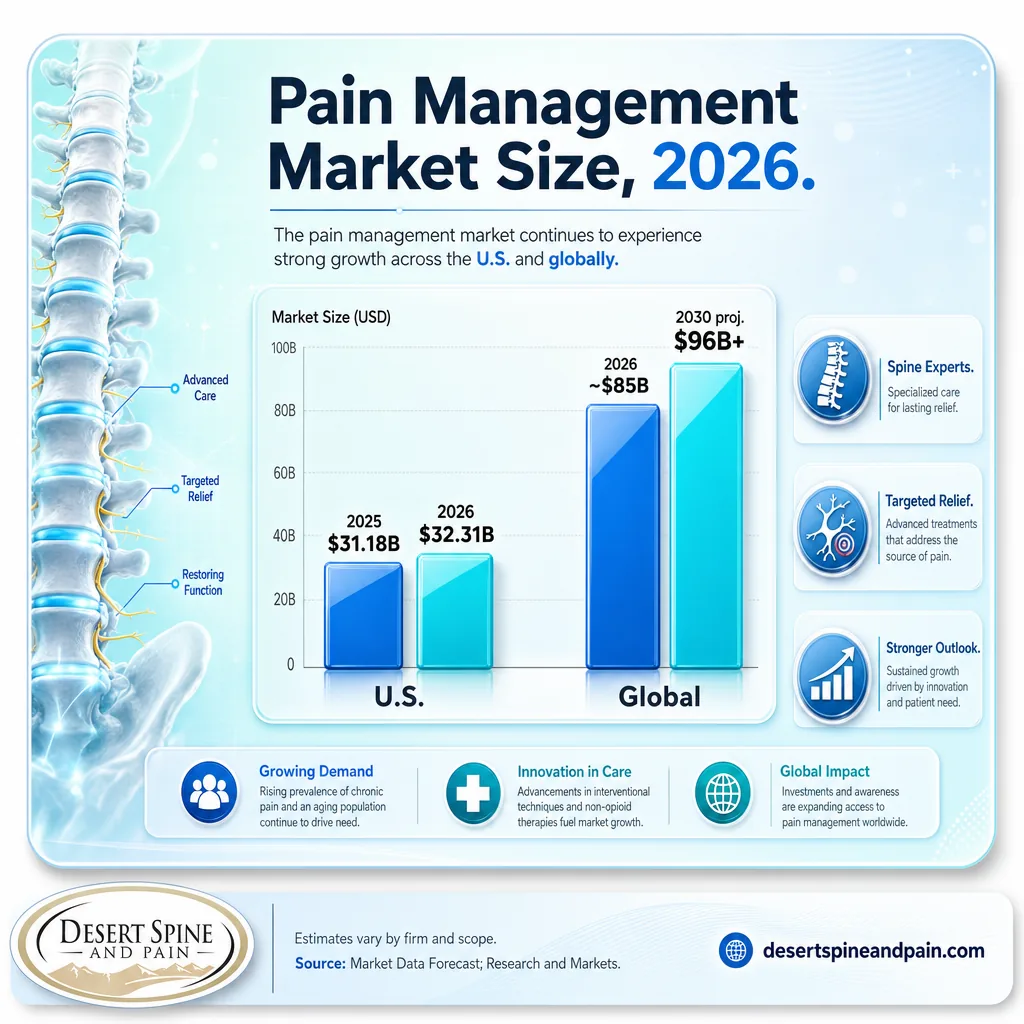
Reading market-size figures carefully
Market-research estimates for pain management vary widely, from about $32 billion (U.S. only) to over $80 billion (global), because firms define the market differently. When comparing figures, always check whether a number is U.S. or global, and which segments (drugs, devices, procedures, therapy) it includes. The ranges in this article are presented deliberately so no single estimate is treated as definitive.
Source: Market Data Forecast, U.S. pain management market | Straits Research, pain management market
Explore interventional pain management
02 Growth Rates and Projections
Whatever the starting figure, the trajectory is consistent: steady mid-single-digit annual growth over the next decade.
Forecasts cluster tightly on growth rate: the U.S. market is projected to grow at about 3.6% CAGR through 2034, reaching $42.87 billion, while global forecasts range from 4.4% to 4.7% CAGR, reaching $96 billion by 2030 in one widely cited estimate. Certain segments grow much faster: pain management devices are projected at roughly 5.6% to 10.25% CAGR, led by neuromodulation platforms, and interventional procedures consistently outpace the overall market as care shifts away from opioids.
Pain Management Market Growth Projections
Source: Research and Markets, pain management market report | Mordor Intelligence, pain management market
Learn about neuromodulation options
03 What's Driving the Industry
The growth is not abstract. It traces to specific, well-documented shifts in demographics and clinical practice.
Four forces dominate the demand side: rapid aging of the population, high rates of osteoarthritis and spinal degeneration, growing surgical volumes requiring pain optimization, and institutional mandates discouraging opioid-first treatment. On the supply side, drugs still account for the majority of revenue (about 69.55% in 2024), but devices and interventional procedures are the fastest-growing segments as multimodal, non-opioid protocols become standard. Enhanced Recovery After Surgery programs and payer bundled-payment incentives are accelerating this shift toward interventional and device-based care.
Desert Spine and Pain Analysis: Why the Growth Favors Interventional Care
Combining two industry data points, pharmacological products holding about 69.55% of revenue while device and interventional segments post the fastest growth rates (up to ~10% CAGR), reveals the direction of travel. The market is not just getting bigger; its composition is shifting toward exactly the minimally invasive, non-opioid interventional procedures that sit at the center of modern spine and pain care. Demand is moving toward the least-invasive-effective model, not away from it.
Formula: Drugs = ~69.55% of revenue but slower growth; devices/interventional = fastest CAGR (~10%) = market composition shifting toward interventional care.
Calculation and interpretation original to Desert Spine and Pain. Source figures: Mordor Intelligence segment share and growth data.
Source: Mordor Intelligence, segment analysis | Market Data Forecast, market drivers
Review non-opioid, conservative care
04 Provider Shortages and Access Gaps
Behind the market's growth is a less flattering reality: many patients cannot easily access the care the industry provides.
A shortage of board-certified pain medicine specialists relative to patient volume has created what market analysts call access "deserts." Federal Health Resources and Services Administration data designates 89% of rural counties as Health Professional Shortage Areas for pain management, with average waits exceeding 14 weeks for interventional procedures in those areas. Insurance friction compounds the problem: market research citing the American Physical Therapy Association reports that 68% of initial physical therapy referrals for low back pain are denied or delayed on medical-necessity review, and diagnostic delays average around 11 months per U.S. Pain Foundation data.
These gaps are precisely where a specialized, accessible practice matters. For out-of-network patients and for personal injury attorneys coordinating timely care for clients, wait times and referral friction are not abstract statistics, they directly affect outcomes and case timelines. A practice built for fast response fills a documented need.
Source: Market Data Forecast (HRSA and APTA data)
See the spine conditions we treat
05 The Shift to Outpatient Interventional Care
One of the clearest structural trends in the industry is the migration of interventional procedures from hospitals to outpatient settings, driven by cost and convenience.
Market analysis indicates that ambulatory settings deliver procedures such as radiofrequency ablation, neurolytic blocks, and generator replacements at an estimated 30% to 50% lower facility cost than inpatient settings, while maintaining similar safety profiles. Payers reinforce this shift by rewarding multimodal, non-opioid protocols with bundled-payment bonuses and prior-authorization waivers. The result is a market steadily reorganizing around efficient, outpatient, interventional care.
Where This Leaves Patients
- Demand is rising for exactly the interventional, non-opioid care that defines modern pain management.
- Access is uneven, with real shortages and wait times in many areas.
- Care is shifting outpatient, making specialized practices more central to how patients receive treatment.
Desert Spine and Pain is led by Dr. David L. Greenwald, a board-certified surgeon who is both a spine surgeon and a neurosurgeon, offering least-invasive-first care from conservative treatment through interventional pain management to complex spine surgery, with the fast response that access gaps make so valuable.
This article summarizes industry and market data and is not financial or investment advice. Market estimates come from independent research firms and vary by methodology. When a case does progress to surgery, the same outpatient-oriented, minimally invasive shift the market reflects is central to how modern spine surgery is delivered.
Source: Mordor Intelligence, outpatient cost analysis
Learn about minimally invasive spine surgeryMeet Dr. Greenwald, spine surgeon and neurosurgeon
06 All the Numbers in One Table
| Statistic | Figure | Source | Year |
|---|---|---|---|
| U.S. pain management market | $32.31B | Market Data Forecast | 2026 |
| U.S. market (prior year) | $31.18B | Market Data Forecast | 2025 |
| U.S. market projection | $42.87B | Market Data Forecast | 2034 |
| Global market (range) | $80-85B | Multiple firms | 2026 |
| Global market projection | $96B+ | Research and Markets | 2030 |
| U.S. market CAGR | 3.6% | Market Data Forecast | 2026-2034 |
| Global market CAGR (range) | 4.4-4.7% | Research and Markets / Mordor | 2026-2030 |
| North America market share | 38% | Straits Research | 2025 |
| Drugs share of market | 69.55% | Mordor Intelligence | 2024 |
| Device segment CAGR | 5.6-10.25% | MRFR / Mordor | 2025-2035 |
| Osteoarthritis-affected U.S. adults | 32.5M | AAOS (cited) | 2026 |
| Rural counties as shortage areas | 89% | HRSA (cited) | 2026 |
| Wait for interventional procedures | 14+ weeks | Univ. Washington Rural Health (cited) | 2026 |
| Low-back PT referrals denied/delayed | 68% | APTA (cited) | 2026 |
| Average diagnostic delay | ~11 months | U.S. Pain Foundation (cited) | 2026 |
| Outpatient facility cost savings | 30-50% | Mordor Intelligence | 2026 |
| Global chronic pain sufferers | ~1.5B | WHO (cited) | 2026 |
07 Frequently Asked Questions
How big is the pain management industry in 2026?
How fast is the pain management market growing?
What is driving growth in pain management?
Is there a shortage of pain management providers?
Why are interventional procedures shifting to outpatient settings?
Methodology & Sources
Market-size and growth figures come from independent market-research firms including Market Data Forecast, Mordor Intelligence, Straits Research, Research and Markets, and Market Research Future. Because these firms define the pain management market differently (some counting only drugs and devices, others including services, procedures, and therapy), estimates vary and are presented as ranges. Clinical and access figures cited within those reports trace to government and institutional sources, including the CDC National Center for Health Statistics, AHRQ Healthcare Cost and Utilization Project, the Health Resources and Services Administration (HRSA), the American Physical Therapy Association, and the World Health Organization.
Market-research estimates are proprietary projections, not measured government statistics, and should be read as informed forecasts. This article is provided for general information and is not financial or investment advice.
Media & press: Journalists and researchers may cite these statistics with attribution to Desert Spine and Pain and a link to this page. The Desert Spine and Pain Analysis box contains original calculation and interpretation.
Talk to a Phoenix Spine and Pain Specialist
Desert Spine and Pain is led by Dr. David L. Greenwald, MD, FACS, a board-certified surgeon who is both a spine surgeon and a neurosurgeon. The practice serves out-of-network patients across Greater Phoenix and partners with personal injury attorneys, offering 24/7 concierge response for their clients. Care follows a least-invasive-first philosophy, from conservative treatment through interventional pain management to complex spine surgery.
Call (602) 566-9500 to book a consultation.



