

Chronic Pain Treatment Statistics (2026): Prevalence, Cost, and Access Data
Chronic pain now affects 24.3% of U.S. adults, more than 51 million people, and carries an estimated $722.8 billion annual economic burden. Yet only about one in four of those patients reach specialized pain management, and utilization of many interventional treatments has fallen sharply since 2019. Here is what the 2026 data says about who has chronic pain, what it costs, and how it is being treated.
Key Takeaways
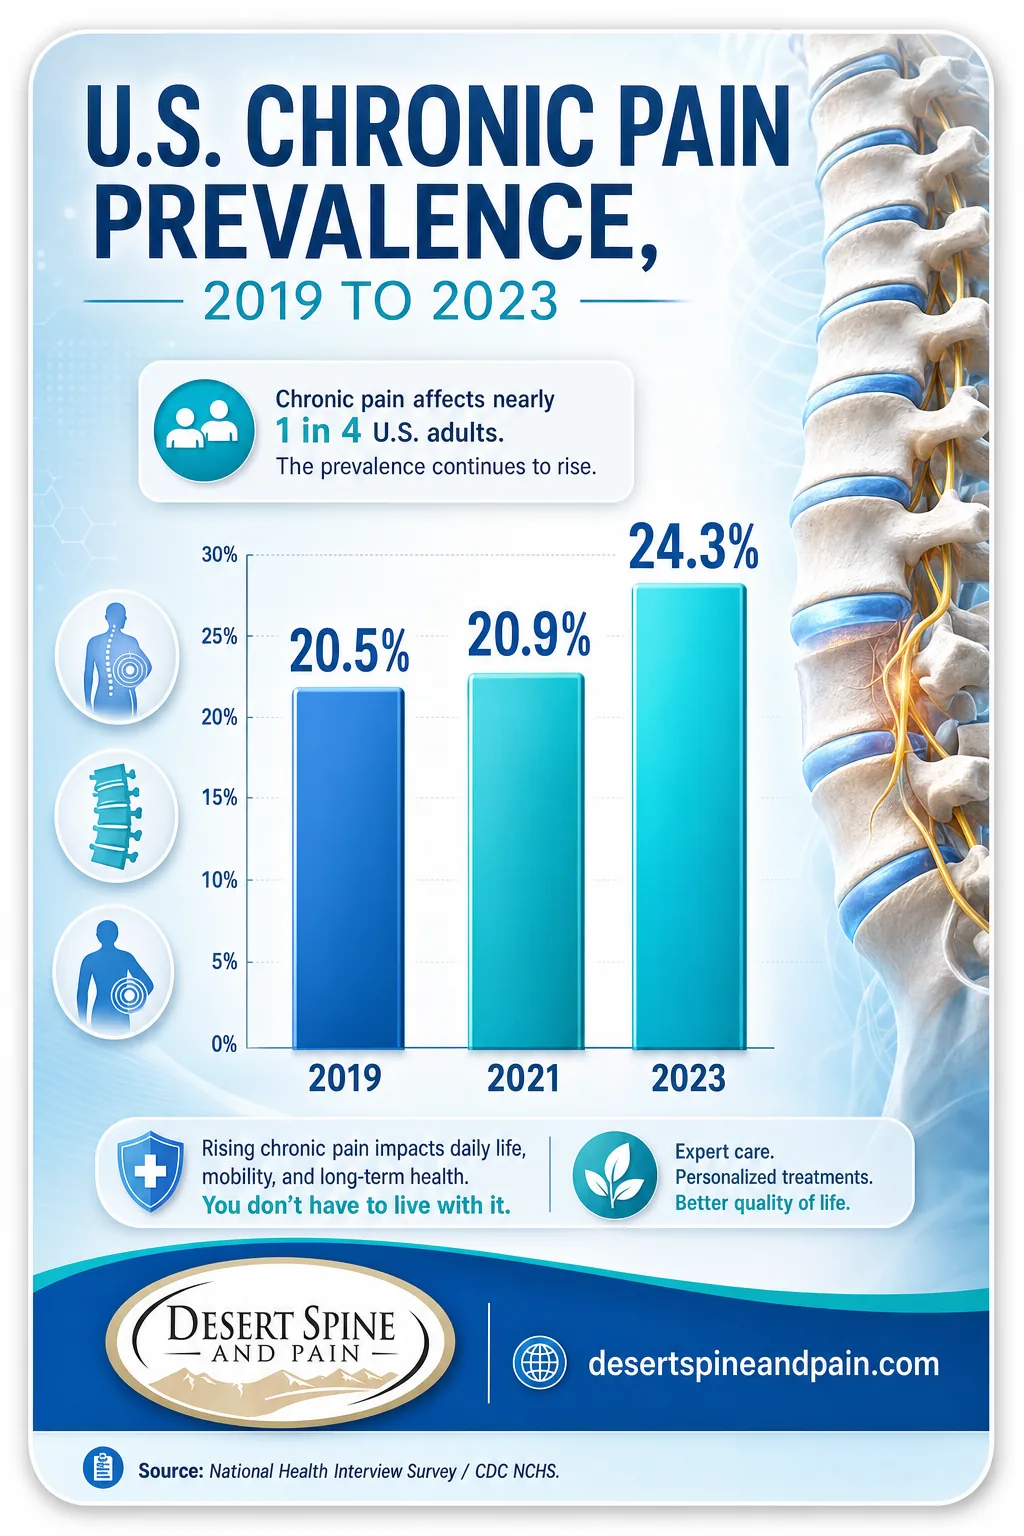
- Chronic pain reached 24.3% of U.S. adults in 2023, up from 20.5% in 2019, an 18% relative increase over four years (National Health Interview Survey).
- More than 51 million adults live with chronic pain, and roughly 8.5% (over 17 million) have high-impact chronic pain that limits daily activities.
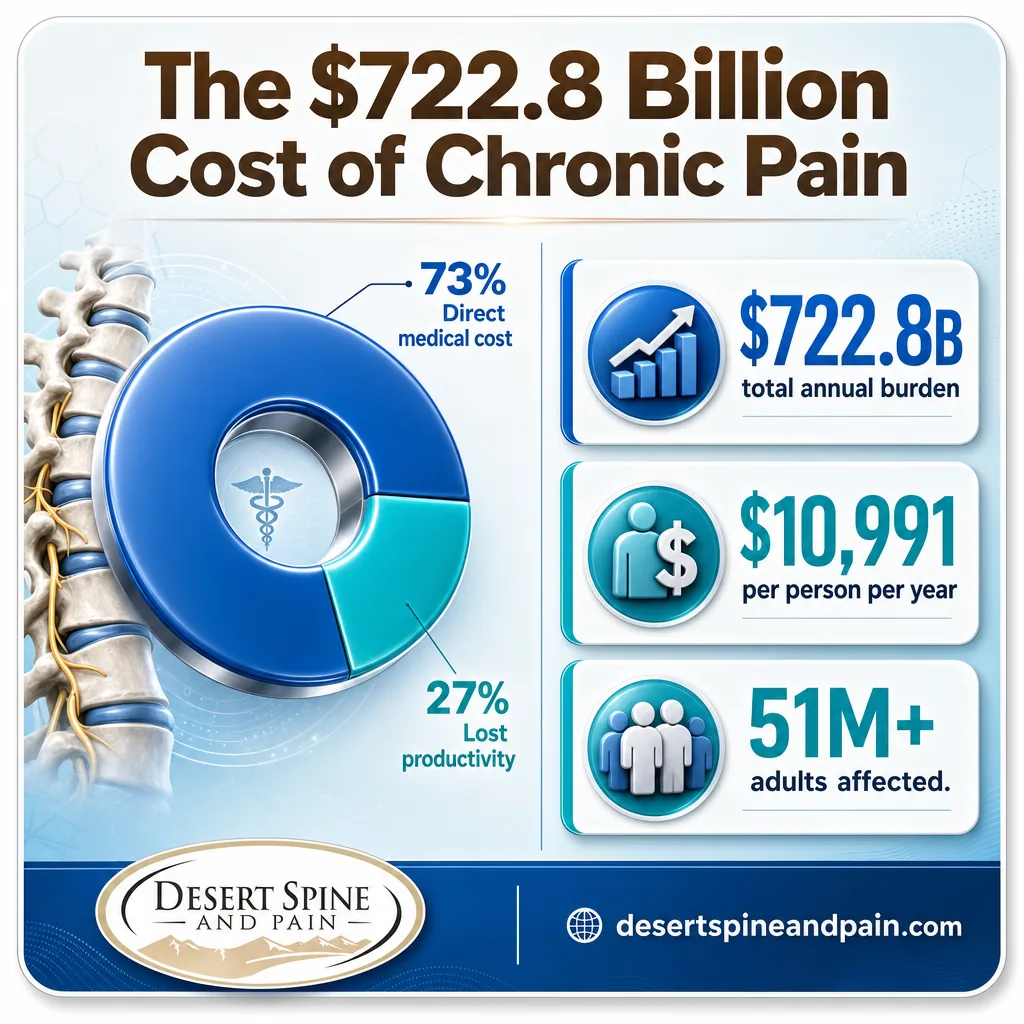
- The total economic burden is about $722.8 billion a year, averaging close to $11,000 per affected person in medical costs and lost productivity.
- Access is uneven: prevalence hits 31.4% in nonmetropolitan areas versus 20.5% in large metro areas, and only about 25% of patients receive specialized pain care.
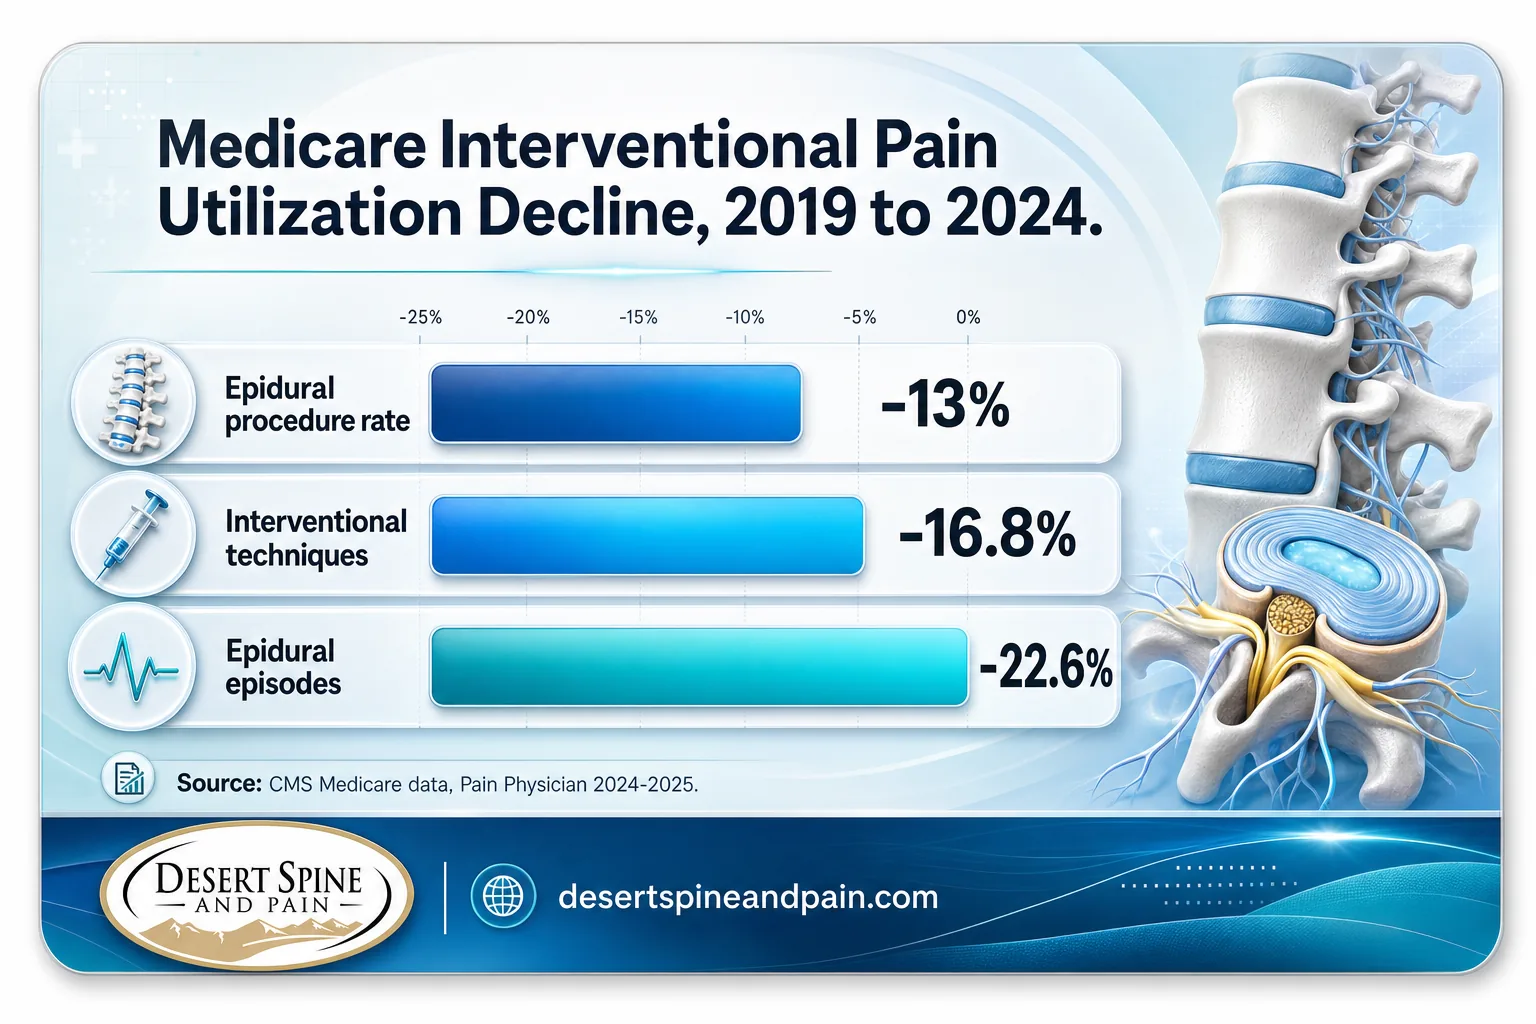
- Interventional procedure use is declining: interventional technique utilization dropped 16.8% and epidural procedures 13% in traditional Medicare from 2019 to 2024.
- Mental health travels with pain: 23.8% of adults with chronic pain report persistent anxiety or depression, versus 4.9% of those without.
- Least-invasive-first still matters: the treatment ladder runs from conservative care and interventional procedures to surgery, reserved for when the underlying structural problem demands it.
What's in This Guide
01 How Common Chronic Pain Is in 2026
Chronic pain is defined as pain on most days or every day for more than three months. By that measure it now touches nearly one in four American adults, and the trend line is moving the wrong way.
The rise is recent and well documented. National Health Interview Survey data show chronic pain prevalence climbing from 20.5% in 2019 to 20.9% in 2021 and then to 24.3% in 2023, an 18% relative increase across the period. High-impact chronic pain followed a similar path, dipping during the pandemic before rising to 8.5% in 2023, so that more than 17 million adults now have pain severe enough to restrict work or daily life.
Age is the clearest demographic driver. Chronic pain rises from 12.3% among adults ages 18 to 29 to 36.0% among those 65 and older. Women report higher rates than men (25.4% versus 23.2%), and prevalence is markedly higher among adults facing socioeconomic disadvantage. For a Phoenix practice, that aging curve matters: the Greater Phoenix metro skews older, and degenerative spine conditions track closely with the age groups carrying the heaviest pain burden.
Source: CDC National Center for Health Statistics, Data Brief 518 | PAIN, January 2026
If back or neck pain has lasted more than three months, a specialist evaluation can identify what is driving it before it becomes high-impact.
Learn about chronic pain syndromes
02 The Economic Burden of Chronic Pain
Chronic pain is among the most expensive health conditions in the United States, and the cost is split unevenly between the medical system and the people living with it.
Estimates vary by methodology and year, but they consistently land in the same range. Older analyses put the annual figure between $560 billion and $635 billion; more recent 2022-based estimates place the burden near $722.8 billion once medical costs and productivity losses are combined. The U.S. Pain Foundation notes that pain is the single most common reason Americans seek healthcare and is reported in roughly 80% of emergency-department visits.
Desert Spine and Pain Analysis: The Per-Person Cost of Waiting
Combining two Tier 1 figures, the roughly $722.8 billion national burden spread across 51 million-plus affected adults works out to about $14,000 per person per year when the full population estimate is used, and roughly $10,991 per person in the more conservative per-capita models. Either way, the direction is the same: delaying evaluation of a treatable spine condition is rarely cheaper than addressing it.
Formula: $722.8B total burden ÷ 51.6M affected adults ≈ $14,000/person (population method); per-capita studies report ≈ $10,991/person.
Calculation and interpretation original to Desert Spine and Pain. Source figures: chronic pain cost roundups citing 2022-based economic burden data and NHIS prevalence counts.
The distribution of who pays is telling. More than half the cost of chronic pain is borne by patients' families and society rather than insurers, and disability payments tied to pain-related conditions account for a meaningful share of Social Security Disability Insurance claims. For out-of-network patients weighing a top-tier surgeon, understanding the full cost picture, not just the sticker price of a procedure, is part of an informed decision.
Source: U.S. Pharmacist, March 2026
Explore interventional pain treatment options
03 Treatment Access and the Care Gap
High prevalence does not mean high-quality treatment is reaching everyone. The data shows a persistent gap between the number of people in pain and the number receiving specialized care.
Geography and income shape access as much as clinical need. High-impact chronic pain is far more common among adults below the federal poverty line (14.4%) than among higher-income adults (3.5%), and nonmetropolitan residents carry both higher prevalence and thinner access to specialists. The mental-health overlap compounds the problem: nearly one in four chronic pain patients also lives with persistent anxiety or depression, which can amplify pain perception and complicate treatment.
Myth: "Chronic pain just has to be managed with medication."
This is one of the most common misconceptions, and the data undercuts it. A large share of chronic spine and nerve pain has an identifiable structural cause, disc disease, stenosis, nerve compression, that can be targeted directly with interventional procedures or, when warranted, surgery. Medication management alone treats the symptom, not the source. A thorough diagnostic workup often reveals options that were never presented. This information is educational and not a substitute for an individual medical evaluation.
Source: U.S. Pharmacist, March 2026 | CDC NCHS Data Brief 518
Meet Dr. Greenwald, spine surgeon and neurosurgeon
04 Interventional Pain Procedure Trends
One of the clearest signals in the data is that interventional pain procedures, injections, nerve blocks, ablation, are being used less often in the Medicare population than they were before 2019, even as pain prevalence rises.
Analyses of CMS Medicare data published in Pain Physician document the shift in detail. From 2019 to 2024, procedural rates for epidural injections fell 13%, treatment episodes fell 22.6%, and overall interventional technique utilization dropped 16.8%. Researchers attribute the decline to the lingering effects of COVID-19, economic pressures, and evolving local coverage determination policies rather than to reduced patient need.
What this means for patients: falling utilization is not evidence that these procedures stopped working. For the right candidate, a well-targeted epidural steroid injection, medial branch block, or radiofrequency ablation can deliver meaningful relief and, importantly, help pinpoint the pain generator before any surgical conversation. The value of a practice that offers the full ladder is that the procedure is chosen to fit the diagnosis, not the other way around.
Source: Pain Physician, 2025 (Manchikanti et al., CMS data) | Pain Physician, 2024
See how epidural steroid injections work
05 Opioids, Alternatives, and the Treatment Ladder
The treatment conversation has shifted decisively toward non-opioid and least-invasive-first care, and the numbers show both the demand for alternatives and the barriers that remain.
Non-pharmacological and interventional alternatives, physical therapy, epidural and joint injections, nerve blocks, radiofrequency ablation, spinal cord stimulation, and non-opioid medications, now sit at the center of guideline-based care. But access barriers persist. Insurance coverage gaps and limited availability of non-opioid therapies are repeatedly cited as obstacles in primary care, which is exactly why a specialty practice that can deliver interventional care directly fills a real gap.
The Least-Invasive-First Ladder
A structured approach escalates only as far as the problem requires:
- Conservative care: non-opioid medication, bracing, diagnostic nerve testing, and physical therapy by referral.
- Interventional pain: epidural steroid injections, facet and joint injections, medial branch and peripheral nerve blocks, radiofrequency ablation, and spinal cord stimulation.
- Surgery: minimally invasive through complex spine surgery, reserved for structural problems that interventional care cannot resolve.
Because Dr. Greenwald is both a spine surgeon and a neurosurgeon, the same practice can carry a patient across the entire ladder without a handoff, and can recognize early when a case genuinely needs surgical expertise versus when it does not.
Physical therapy is provided by referral, and behavioral and multidisciplinary approaches round out a plan built around each patient's diagnosis. The goal throughout is the least-invasive effective treatment first, with surgery considered only when the underlying condition demands it. This is general information and not individual medical advice; a consultation is the right place to determine what fits a specific case.
Source: EBioMedicine, July 2025 | U.S. Pharmacist, March 2026
Review conservative, non-invasive care
06 All the Numbers in One Table
| Statistic | Figure | Source | Year |
|---|---|---|---|
| U.S. adults with chronic pain | 24.3% | NHIS / CDC NCHS | 2023 |
| Adults living with chronic pain | 51M+ | NHIS / U.S. Pharmacist | 2026 |
| High-impact chronic pain prevalence | 8.5% | NHIS / CDC NCHS | 2023 |
| Adults with high-impact chronic pain | 17M+ | U.S. Pharmacist | 2026 |
| Chronic pain prevalence, 2019 | 20.5% | PAIN journal (NHIS) | 2026 |
| Relative increase, 2019 to 2023 | 18% | PAIN journal (NHIS) | 2026 |
| Prevalence, ages 65+ | 36.0% | CDC NCHS Data Brief 518 | 2023 |
| Prevalence, ages 18 to 29 | 12.3% | CDC NCHS Data Brief 518 | 2023 |
| Women vs men prevalence | 25.4% vs 23.2% | U.S. Pharmacist (NHIS) | 2026 |
| Total annual economic burden | $722.8B | Cost roundup (2022 data) | 2026 |
| Burden per person per year | $10,991 | Cost roundup | 2026 |
| Direct medical share of cost | ~73% | Cost roundup | 2026 |
| Nonmetropolitan prevalence | 31.4% | U.S. Pharmacist (NCHS) | 2026 |
| High-impact pain below poverty line | 14.4% | NCHS Data Brief (2024) | 2024 |
| Chronic pain with anxiety/depression | 23.8% | U.S. Pharmacist (NHIS) | 2026 |
| Interventional technique utilization decline | -16.8% | Pain Physician (CMS) | 2019-2024 |
| Epidural procedure rate decline | -13% | Pain Physician (CMS) | 2019-2024 |
| Epidural episode decline | -22.6% | Pain Physician (CMS) | 2019-2024 |
| Pain as factor in ED visits | ~80% | U.S. Pain Foundation | 2026 |
07 Frequently Asked Questions
How many Americans have chronic pain in 2026?
What does chronic pain cost the U.S. economy?
What percentage of chronic pain patients receive specialized treatment?
Are interventional pain procedures being used more or less over time?
What treatments are used before or instead of opioids for chronic pain?
Methodology & Sources
All figures in this article trace to Tier 1 primary sources: U.S. government health agencies, peer-reviewed journals, and national survey data. Prevalence and demographic figures come from the CDC National Center for Health Statistics (NCHS) Data Brief 518 and the National Health Interview Survey (NHIS), 2019 to 2023 waves, as analyzed in PAIN (journal), January 2026 and the Journal of Pain, 2026. Economic burden figures reflect 2022-based estimates compiled from published cost analyses and the U.S. Pain Foundation, reported via U.S. Pharmacist, March 2026. Interventional procedure utilization data come from CMS Medicare Part B records analyzed by Manchikanti et al. in Pain Physician (2024 and 2025). Opioid and alternative-treatment context draws on EBioMedicine, July 2025.
Cost estimates vary by methodology and study year; ranges are noted where sources differ. Prevalence figures reflect the most recent complete survey year (2023) and are described as 2026 statistics because they represent the current published data available in 2026.
Media & press: Journalists and researchers are welcome to cite these statistics with attribution to Desert Spine and Pain and a link to this page. The Desert Spine and Pain Analysis box contains original calculation and interpretation.
Talk to a Phoenix Spine and Pain Specialist
Desert Spine and Pain is led by Dr. David L. Greenwald, MD, FACS, a board-certified surgeon who is both a spine surgeon and a neurosurgeon. The practice serves out-of-network patients across Greater Phoenix and works closely with personal injury attorneys, offering 24/7 concierge response for their clients. Care follows a least-invasive-first philosophy, from conservative treatment through interventional pain management to complex spine surgery.
Call (602) 566-9500 to book a consultation.



