

Back Surgery Statistics (2026): Volume, Success, Failure, and Repeat Surgery
Roughly 900,000 Americans undergo spine surgery every year, including about 500,000 lumbar procedures. Primary back surgery succeeds most of the time for well-selected patients, but the data carries a clear warning: success drops sharply with each repeat operation, from above 50 percent for a first surgery to around 5 percent by the fourth. Getting the first surgery right is everything.
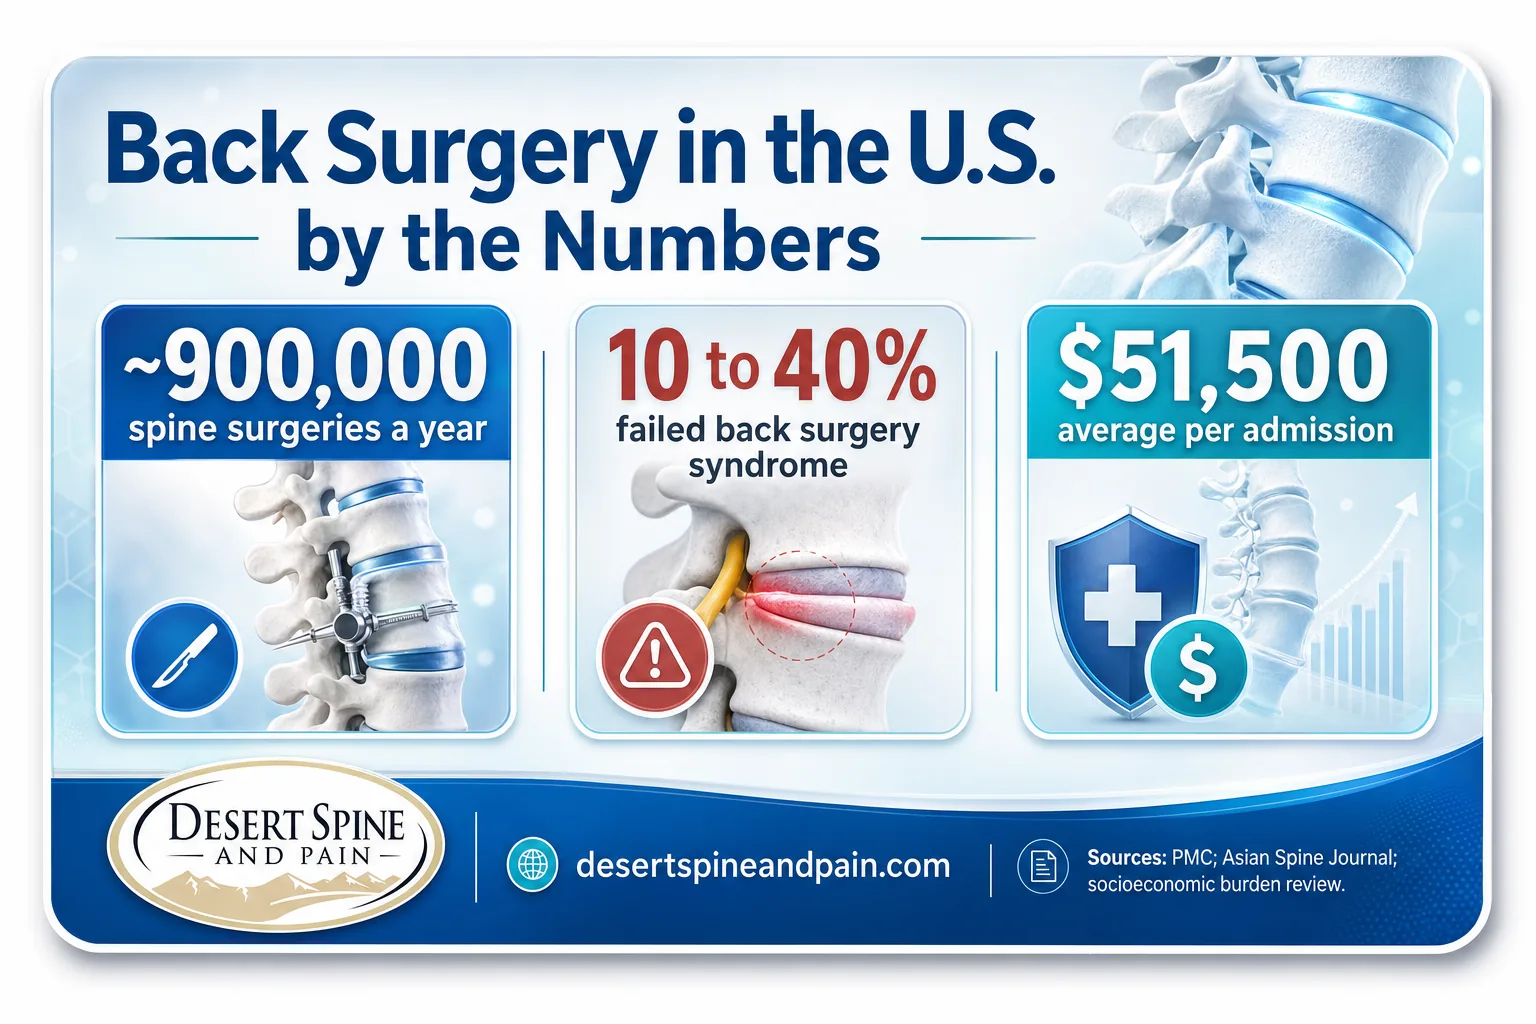
- About 900,000 Americans undergo spine surgery annually, including roughly 500,000 lumbar spine surgeries.
- Elective lumbar fusion volume rose 62.3 percent between 2004 and 2015 (from 60.4 to 79.8 per 100,000), and U.S. lumbar surgery rates are the highest in the world.
- Back surgery success is generally reported at 60 to 90 percent for primary procedures, varying by operation and patient.
- Repeat surgery success declines steeply: above 50 percent (first), ~30 percent (second), ~15 percent (third), ~5 percent (fourth).
- Failed back surgery syndrome affects 10 to 40 percent of back surgery patients across the literature.
- ASR 2026 data shows a lumbar fusion reoperation rate of 13.9 percent and revision rate of 7.6 percent.
- Complication rates run about 1 to 8.6 percent, with fusion mortality of 0.13 to 0.2 percent; risk rises with age, complexity, and repeat surgery.
What's in This Guide
1How Many Back Surgeries Are Performed
"Back surgery" is a broad term covering everything from discectomy and decompression to fusion. Because a single operation can be coded as several procedures, exact counts vary, but the scale is consistently large.
The United States has the highest rate of lumbar spine surgery in the world, with rates among older adults rising more than 200 percent since 1990. This growth reflects an aging population and broader surgical indications, but it also raises the stakes of deciding whether surgery is truly the right step, since roughly 10 to 15 percent of the population lives with chronic back pain and only a fraction benefit from an operation.
Our Phoenix practice, led by board-certified neurosurgeon and spine surgeon Dr. David L. Greenwald, MD, FACS, reserves surgery for patients who genuinely need it and always weighs conservative and minimally invasive options first.
Explore back surgery options in PhoenixSource: Spine surgery volume analysis, PMC | Socioeconomic burden of low back pain, PMC
2Back Surgery Success Rates
Success rates for back surgery depend on the procedure, the condition, and how success is defined. For a well-selected first surgery, outcomes are generally good, but the honest range is wide.
Reported Success Rate by Common Back Procedure
Ranges reflect primary procedures in appropriately selected patients. Sources: peer-reviewed compilation; surgical series.The variation is real and worth understanding. Procedure-specific rates for fusion, decompression, and disc replacement are high in well-selected patients, while broader "all back surgery" figures that mix procedures, indications, and repeat operations land lower. The single biggest driver of where a given patient falls is whether the diagnosis is accurate and the operation appropriate.
Meet Dr. GreenwaldSource: Spine Together (peer-reviewed compilation) | Lumbar surgery success cohort, PMC 2022
3Failed Back Surgery Syndrome
Failed back surgery syndrome (FBSS) is the term for persistent pain after an operation meant to relieve it. It is common enough to have earned its own medical classification, and understanding it is essential for anyone considering back surgery.
A key insight from the FBSS literature is that failure is often not a technical error in the operating room. As surgical reviews note, back surgery can really only accomplish two things: decompress a pinched nerve or stabilize an unstable joint. When pain has a different or additional source, even a flawlessly executed surgery may not relieve it. That makes accurate diagnosis the decisive factor.
Usually not. Failed back surgery syndrome is frequently the result of operating on the wrong pain generator, not operating badly. A perfectly performed fusion at a level that was not actually the source of pain will not help. This is precisely why the evaluation before surgery, identifying the true cause of pain and confirming that surgery can address it, matters more than almost anything that happens during the procedure itself.
For patients already living with FBSS, options such as spinal cord stimulation exist. Research shows spinal cord stimulation outperformed reoperation for certain radicular pain and produced less than half the complications of repeat surgery in one large analysis.
Learn about spinal cord stimulationSource: Failed Back Surgery Syndrome review, PMC | Frontiers in Pain Research, 2022
4Why Repeat Surgeries Succeed Less Often
Perhaps the most important statistic for anyone facing back surgery is what happens when a first operation does not work and a second is considered. The data is sobering and consistent.
Back Surgery Success Rate by Number of Operations
Success declines steeply with each additional operation. Source: peer-reviewed literature via clinical review.
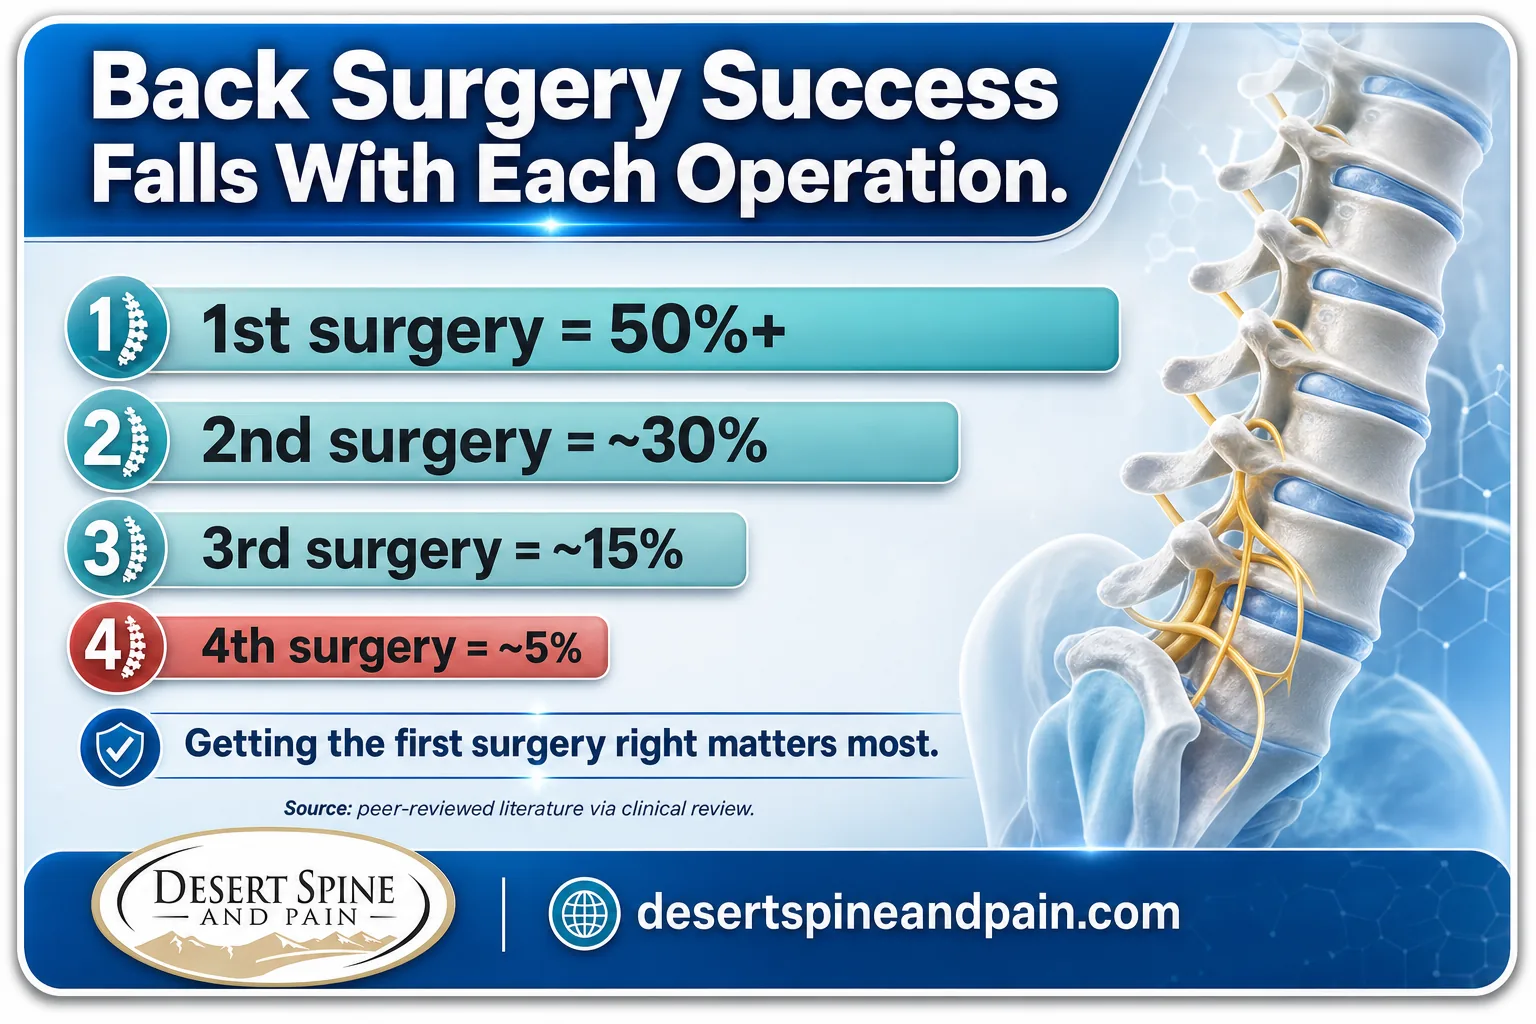
Two lessons emerge. First, the steep decline (roughly 50 percent, then 30, 15, and 5 percent) shows that each additional surgery is a harder problem with lower odds. Second, the exception proves the rule: when a repeat operation targets a clearly identified, correctable cause like a confirmed recurrent disc herniation, success can reach 70 to 77 percent. The difference is diagnostic certainty. This is the strongest possible argument for choosing an experienced surgeon for the first operation.
The gap between primary surgery success (above 50 percent) and second surgery success (around 30 percent) means the odds of a good outcome can nearly halve when a first operation misses. Yet targeted revision for a confirmed, correctable cause reaches 70 to 77 percent. The math points to one conclusion: the value of a precise initial diagnosis and an experienced surgeon is enormous, because the first surgery is by far the best chance. Interpretation original to Desert Spine and Pain.
Dr. Greenwald's dual training as a spine surgeon and neurosurgeon supports exactly this kind of precise diagnosis and careful case selection, and our practice regularly evaluates complex and revision cases for out-of-network patients from across the country.
Book a consultation with Dr. GreenwaldSource: Repeat surgery success data via clinical review | Recurrent disc herniation reoperation study, PMC
5Complications and Recovery
Understanding the risk and recovery profile of back surgery helps patients set realistic expectations and weigh surgery against conservative care.
Recovery timelines vary by procedure. Decompression often takes four to six weeks, while full spinal fusion healing can take up to 12 months. Preoperative factors matter too: research links a longer duration of chronic low back pain before surgery to more severe acute postoperative pain, underscoring the value of not delaying appropriate care indefinitely while also not rushing into an operation.
Desert Spine and Pain partners closely with personal injury attorneys, offering 24/7 concierge response and documentation coordination for injured clients whose recovery timeline directly affects both their health and their case.
See conservative care options first
Source: Lown Institute Hospitals Index | Chronic pain duration and postoperative pain study, PMC
6Cost and Overuse
Back surgery is among the most expensive interventions in medicine, and cost data is closely tied to questions of appropriateness.
The Lown Institute has repeatedly documented low-value back procedures in Medicare data, a reminder that the goal is not more back surgery or less, but the right surgery for the right patient. For personal injury clients and out-of-network patients alike, a surgeon who declines to operate when surgery is not indicated protects both health and finances.
Review the conditions we treatSource: Socioeconomic burden of low back pain, PMC | Lown Institute Hospitals Index
Summary Table: Back Surgery Statistics 2026
| Statistic | Figure | Source | Year |
|---|---|---|---|
| Americans having spine surgery annually | ~900,000 | PMC literature | 2023 |
| Annual U.S. lumbar spine surgeries | ~500,000 | Frontiers in Pain Research | 2022 |
| Lumbar fusion volume growth 2004 to 2015 | +62.3% | Socioeconomic burden review | 2024 |
| Lumbar surgery rate increase since 1990 (older adults) | 200%+ | Clinical trial protocol lit. | 2023 |
| Fusion success rate | ~90% | Peer-reviewed compilation | 2026 |
| Decompression success rate | 71 to 90% | Peer-reviewed compilation | 2026 |
| Overall back surgery success (some series) | 60 to 80% | Clinical literature | 2024 |
| Patient satisfaction (486-cohort) | 80.7% | PMC cohort | 2022 |
| Primary surgery success | 50%+ | Clinical review | 2026 |
| Second surgery success | ~30% | Clinical review | 2026 |
| Third surgery success | ~15% | Clinical review | 2026 |
| Fourth surgery success | ~5% | Clinical review | 2026 |
| Failed back surgery syndrome | 10 to 40% | Asian Spine Journal / reviews | 2018 |
| Lumbar fusion reoperation rate | 13.9% | American Spine Registry | 2026 |
| Lumbar fusion revision rate | 7.6% | American Spine Registry | 2026 |
| Complication rate range | 1 to 8.6% | Johns Hopkins / Global Spine J | 2024 |
| Spinal fusion mortality | 0.13 to 0.2% | Int'l J Spine Surgery | 2018 |
| Average cost per admission | $51,500 | Socioeconomic burden review | 2024 |
Frequently Asked Questions
How many back surgeries are performed each year in the United States?
What is the success rate of back surgery?
What is failed back surgery syndrome and how common is it?
Do repeat back surgeries work as well as the first?
How risky is back surgery?
Methodology & Sources
How we compiled these statistics
Every figure traces to a Tier 1 primary source: national registries, government-linked databases, and peer-reviewed journals. Volume counts differ by method because a single operation can be coded as multiple procedures. Success and failure ranges reflect differences in procedure, patient selection, and definition. The repeat-surgery success pattern is a widely cited clinical finding; individual results depend on the specific diagnosis. All statistics describe populations, not any individual patient.
Primary sources referenced:
- American Spine Registry (AANS/AAOS) 2026 Annual Report, via Becker's Spine Review
- Frontiers in Pain Research (Cleveland Clinic / Stanford), spine surgery volume and persistent pain, 2022
- Comparative Review of the Socioeconomic Burden of Lower Back Pain, PMC
- Failed Back Surgery Syndrome: A Review Article, PMC
- Success and failure after lumbar degenerative surgery prospective cohort (486 patients), PMC, 2022
- Recurrent disc herniation reoperation study, PMC
- Lown Institute Hospitals Index, Unnecessary Back Surgery
- Peer-reviewed success-rate literature compiled with citations by Spine Together
This article is educational and is not individual medical advice. For guidance specific to your spine condition, consult a qualified spine surgeon. No outcome can be guaranteed.
Journalists and researchers may cite these statistics with attribution to Desert Spine and Pain and a link to this page. Please attribute the underlying figures to their original Tier 1 sources as listed above. For expert commentary on back surgery data from a board-certified neurosurgeon and spine surgeon, contact Desert Spine and Pain at (602) 566-9500.



